
Crypto Strategy Returns in 2026 and the Next Opportunity Set

Summary
This note summarizes 1Token research on crypto trading strategy performance in 2025 and 2026, based on data from 1ndex . Three findings stand out:
- Returns became harder to earn in 2026. Average returns fell for delta-neutral, dollar-neutral and directional strategies. Delta-neutral strategies had 5 of 9 months above a 10% annualized return from January to September 2026, down from 7 of 9 in 2025. Recovery from drawdowns also took longer.
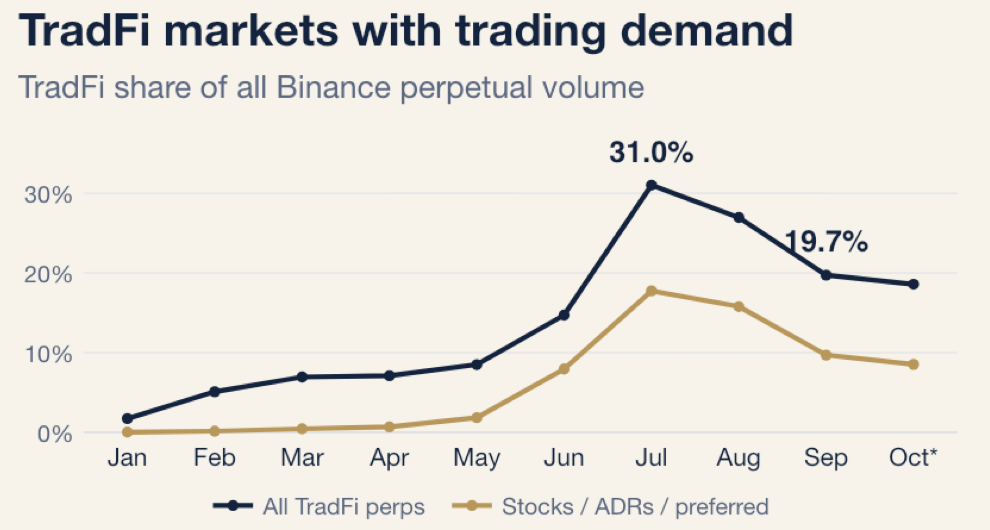
- Managers are widening their opportunity set. TradFi perpetuals grew from 1.7% of Binance perpetual volume in January 2026 to a peak of 31.0% in July, led by stock perpetuals.
- Three areas merit further research: stock perpetuals (15–25% indicative annual return), delta-neutral stablecoin yield (~30% manager-indicated), and prediction-market arbitrage (40–100% indicative, with limited capacity).
Background and data
This note builds on a talk by Joey Shi at 1Token's allocator and trading team session in Singapore, held during TOKEN2049 week in October 2026.
Full slides (PDF): Crypto Strategy Returns and the Next Opportunity Set
The data comes from two sources. The 2025 figures come from 1Token's 2025 annual report (25 teams, 50+ strategies). The 2026 figures come from 1ndex (25 teams, 45 strategies in the performance sample). 1ndex is 1Token's strategy discovery and pre-investment due diligence (IDD) platform, launched in May 2026, where allocators compare crypto trading strategies on verified data. 1Token provides portfolio and risk management software to institutional crypto investors.
1. Performance: lower returns and slower recoveries in 2026
Average returns fell across all three strategy types in the sample, and drawdowns took longer to recover. Risk-adjusted returns held up better for neutral strategies than for directional ones.
Strategy type | Avg. return 2025 → 2026 | Avg. max drawdown 2025 → 2026 | Avg. Sharpe 2025 → 2026 | Mean longest recovery 2025 → 2026 |
|---|---|---|---|---|
Delta neutral | 10.7% → 7.3% | 0.8% → 1.8% | 2.61 → 3.34 | — |
Dollar neutral | 34.7% → 11.6% | 9.5% → 8.2% | 1.69 → 2.82 | 36.8 days → 44.1 days |
Directional | 43.3% → 11.2% | 19.3% → 18.3% | 0.82 → 0.61 | 93.5 days → 109.0 days |
The strong months also became rarer. For delta-neutral strategies, 7 of 9 months from January to September 2025 had a monthly return above a 10% simple annualized rate. In the same window of 2026, only 5 of 9 did. The peak month fell from 3.03% in October 2025 (36.3% annualized) to 1.71% in April 2026 (20.5% annualized).
This metric captures how often strong months occurred, not the full-year return. Taken together with longer recovery times, it suggests that headline returns alone understate the change in the return environment. Recovery time is a useful second lens for allocators assessing drawdown risk.
2. Positioning: broader asset sets and a shift toward TradFi
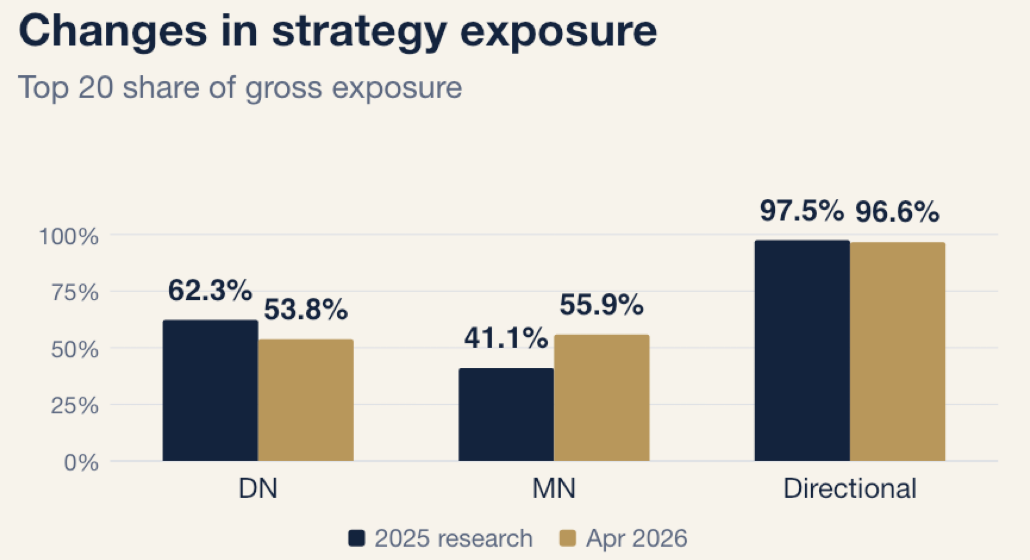
Teams are changing what they trade. Delta-neutral strategies are spreading across more assets: the top 20 assets' share of gross exposure fell from 62% in 2025 to 54% in April 2026. Market-neutral strategies moved the other way, concentrating in large tokens (41% to 56%). Directional strategies were already concentrated (97%).
The bigger shift is into traditional finance (TradFi) assets. TradFi perpetuals rose from 1.7% of all Binance perpetual volume in January 2026 to 31.0% in July, then eased to 19.7% in September. Stock, ADR and preferred-share perps alone reached 17.7% in July. Assets in research included gold (PAXG, XAUT, XAU), silver and oil, and stock perps such as NVDA, TSLA, AAPL, HOOD, SK hynix and Sandisk. This widens the set of markets where existing crypto trading methods can be applied. The underlying reasons differ by manager and require manager-level analysis.
3. Opportunity set: three areas for further research
The data points to three areas where return opportunities may emerge. Strategies in each are under evaluation for 1ndex. The return figures below are indicative targets from managers under discussion, not realized results.
Opportunity | How it works | Indicative annual return | Main limits |
|---|---|---|---|
Stock perpetuals | Trade volatile stock perps and capture funding-rate swings. Volatility: Micron 76.8%, Sandisk 112.8%, vs. BTC 38.1%. | 15–25% | Execution and costs; funding varies month to month |
Delta-neutral stablecoin yield | Manage neutral positions and P&L so the yield-bearing balance can exceed NAV, earning rewards on products such as BFUSD and RWUSD. | ~30% (manager-indicated) | Product yields, margin rules, leverage risk |
Prediction-market arbitrage | Trade price gaps for the same event across Polymarket, Kalshi and Predict. Median cross-venue midpoint gaps are 1.48–1.59 percentage points. | ~100% under US$1m; 40–60% at larger size | Capacity, execution cost; Polymarket's median quoted spread is 3.3% vs. 0.01% on Binance perps |
A quoted price gap is a starting point, not net profit. Small allocations may reach higher returns, while scaling up shrinks the opportunity.
4. Implications for allocators and next steps
For allocators, the findings point to three practical adjustments: compare strategies on recovery time as well as return, expect managers to trade a wider set of assets including TradFi perpetuals, and test new strategy types against capacity and execution cost before sizing an allocation.
As of October 2026, 1ndex lists 26 trading teams and 47 strategies, serves 120+ institutional investors, and has made 200+ team–investor introductions. Its target for next quarter is 60–80 teams and 100+ strategies.
The next two goals are:
- More strategy choice. 1ndex will broaden coverage across CeFi (Binance, Bybit, OKX, Deribit), DeFi (Hyperliquid, Aster, Morpho, Pendle), prediction markets (Polymarket, Kalshi) and TradFi brokers (IBKR, Futu, Tiger). It builds on 1Token CAM coverage of 85 CeFi venues, 164 DeFi chains and 4,350 DeFi protocols.
- Complete pre-investment due diligence. AI agents will combine 1ndex data (NAV, strategy records) with external data (manager decks, market data). They will help verify performance, compare strategies and analyze risk and return. The output is evidence, diligence questions and investment briefs, so allocators can spend their time on decisions that need judgment.
Data: 1Token 2025 annual report and the 1ndex platform, as of 5 October 2026. For market education only. Past performance is not indicative of future results. Explore strategies at 1ndex.1token.tech.
Comments ()