
Crypto Quant Strategy Index XVI October 2026
Executive summary
October gave neither kind of book much to work with. Funding paid little on the majors, volatility was low, and the market fell broadly: only 8% of 242 coins rose and the median coin lost 19.9%. Hedged books had little carry to collect, and directional books got a decline without a trend. Two of the three buckets lost money.
-
Delta Neutral, +0.79%. Funding did the work and price did not. The six books collected 1.09% of their own equity in funding, all six positive, against 0.12% of trading fees and 0.27% of financing costs; trading added 0.19% and the residual 0.07%, for +0.95% in total. That funding is 13.1% a year on equity, or 3.6% per unit of gross at 3.68 turns: a hedged book earns a spread on leverage, not a direction.
-
Market Neutral, −0.48%. The month produced the index's worst drawdown of 2026, 1.50%, and it was still open at the end of October. Twelve of the eighteen strategies made money and six lost, and the median rose 0.34%: the loss came from a few books, not from the market. The worst fell 5.08% and the best gained 2.62%. Hedging to zero net exposure stops a book taking a view on the market; it does not stop the two legs of a pair moving apart.
-
Directional, −1.98%. The market fell, but never in a straight line. BTC lost 7.50% and the median coin 19.86%, yet no single day moved BTC more than 4.12%. Fifteen of the twenty-two strategies lost money and the median fell 2.90%; three lost more than 10% and two gained more than 10%.
Parameters
| Parameter | Value |
|---|---|
| Quote source | 1Token 1ndex daily NAV for the strategy series; CoinGecko for spot prices and market-cap ranking. |
| Granularity | Daily |
| Index start | Delta Neutral 1 January 2021, Market Neutral 2 May 2019, Directional 1 January 2020, at 00:00 UTC |
| Cut-off | 00:00 UTC, month end |
| Sample venues | Binance 55.1%, Bybit 24.8%, OKX 10.6%, Gate 7.1%, Bitget 1.8% and LTP RapidX 0.7% of sample net assets, across 21 trading accounts |
| Accumulated NAV | Time-weighted (TWR) |
| Risk-free rate | 4.5% (2026 average of the US 10-year Treasury yield) |
| Daily MAR | 0 |
| Note | Exchange selection may affect reported performance because fee structures, commissions, execution conditions and slippage differ across venues. The index does not adjust for these venue-specific differences, which should be considered when comparing results. |
Index performance
| Bucket | Jan | Feb | Mar | Apr | May | Jun | Jul | Aug | Sep | October | 2026 YTD |
|---|---|---|---|---|---|---|---|---|---|---|---|
| Delta Neutral | +1.17% | −0.06% | +1.31% | +1.72% | +1.41% | +0.72% | +1.02% | +0.85% | +1.03% | +0.79% | +10.39% |
| Market Neutral | +3.87% | +0.24% | +0.45% | +2.78% | +1.98% | +0.13% | +0.74% | +0.84% | +0.40% | −0.48% | +11.40% |
| Directional | +5.52% | +3.79% | −5.39% | −2.44% | +2.26% | −1.08% | −0.89% | +13.35% | +1.94% | −1.98% | +14.78% |
Table 1. Monthly index returns for 2026; the last column compounds the ten months. The platform re-based every index at the October close; earlier issues stand as published.
| Bucket | Oct return | Oct vol. | Oct max DD | YTD return | YTD vol. | YTD max DD | SI return | SI vol. | SI max DD |
|---|---|---|---|---|---|---|---|---|---|
| Delta Neutral | +0.79% | 0.63% | 0.08% | +10.39% | 0.92% | 0.40% | +530% | 13.37% | 20.44% |
| Market Neutral | −0.48% | 3.15% | 1.50% | +11.40% | 3.36% | 1.50% | +885% | 8.26% | 4.98% |
| Directional | −1.98% | 6.44% | 3.58% | +14.78% | 12.54% | 10.03% | +7,471% | 32.26% | 24.35% |
Table 2. October, year-to-date and since inception. Since inception starts at each index's first observation.
| Bucket |
Strategies | CAM net assets (USD) | Average of constituents | Index | Gross exposure (× NAV) |
|---|---|---|---|---|---|
| Delta Neutral | 24 | 8,881,945 | +0.79% | +0.79% | 3.68 |
| Market Neutral | 18 | 3,697,668 | −0.40% | −0.48% | 1.95 |
| Directional | 22 | 1,590,979 | −1.58% | −1.98% | 0.54 |
Table 3. The constituents and the index in October. The average column is the equal-weighted return of the strategies in each bucket.
October market conditions
Funding on Binance's large-cap perpetuals averaged 4.2% annualised across 16 symbols and was positive on 78% of days. Smaller caps paid more, 6.5% across 35 symbols, so cheap funding was concentrated in the majors. The December quarterly BTC future averaged 4.9%, and tokenised equities 4.9%. Rates also differed by venue on the same eleven large caps: Bitget ran 2.3 points above the other four.
BTC realised volatility was 28.0%, the 15th percentile of its twelve-month range, against 35.3% for ETH. Implied volatility was low too, BTC's DVOL at 37.7 and ETH's at 51.6, both near the foot of their own ranges.
Breadth was narrow. Of 242 coins, 8% rose, the median fell 19.9% and BTC fell 7.5%. At a median beta of 1.60, BTC's fall alone explains a 12.0% decline, so the median coin fell 1.7 times further than beta accounts for. PoW fell least at 15.7% and DEX most at 23.6%.
Delta Neutral
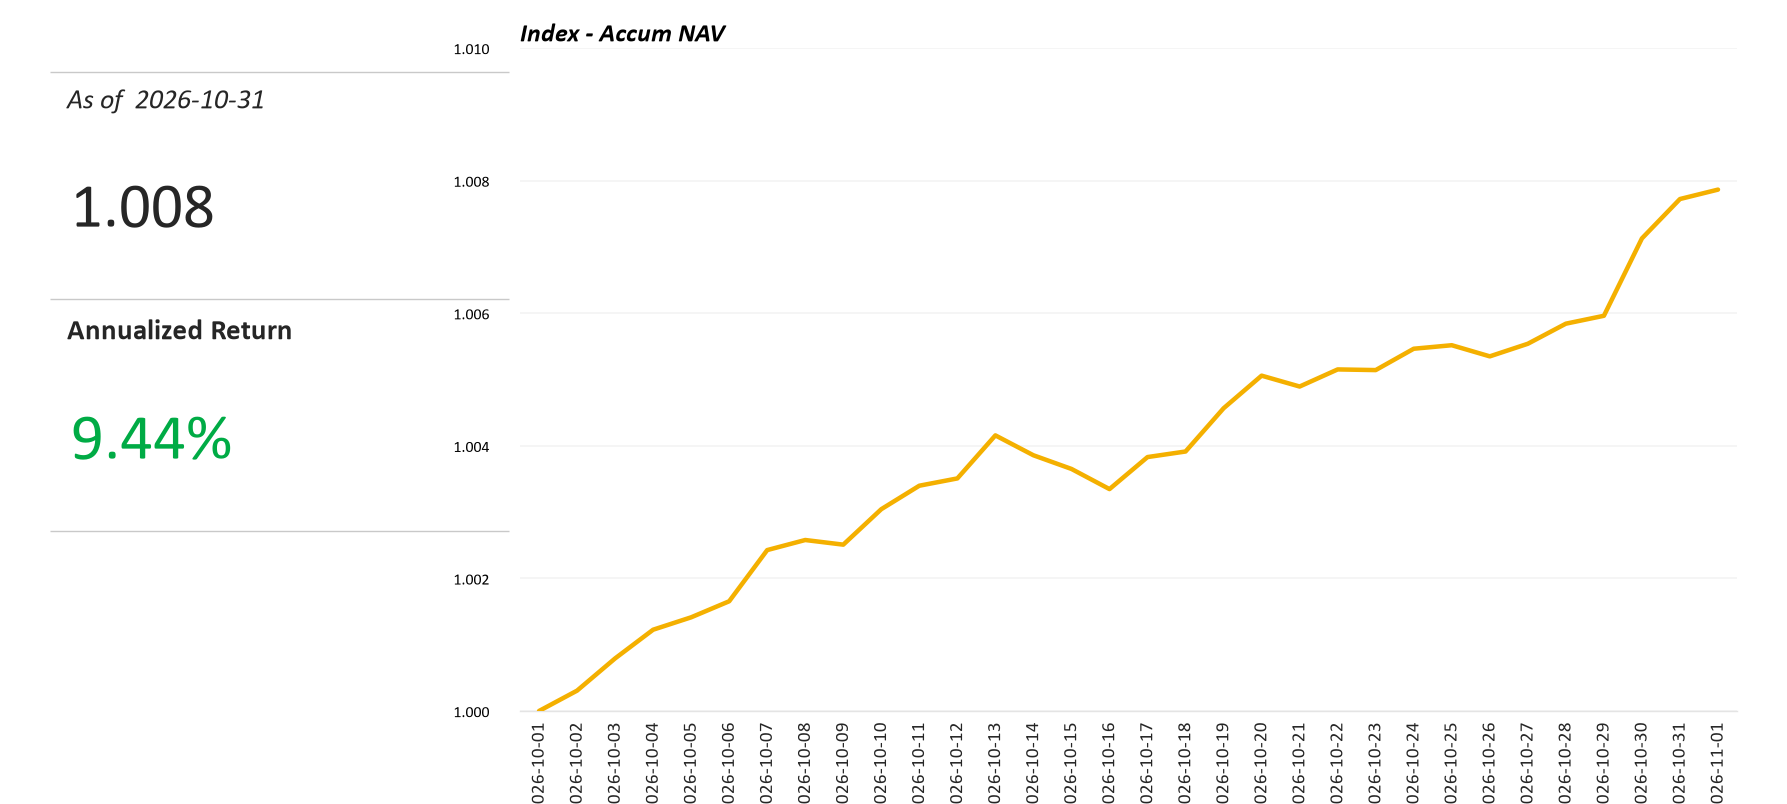
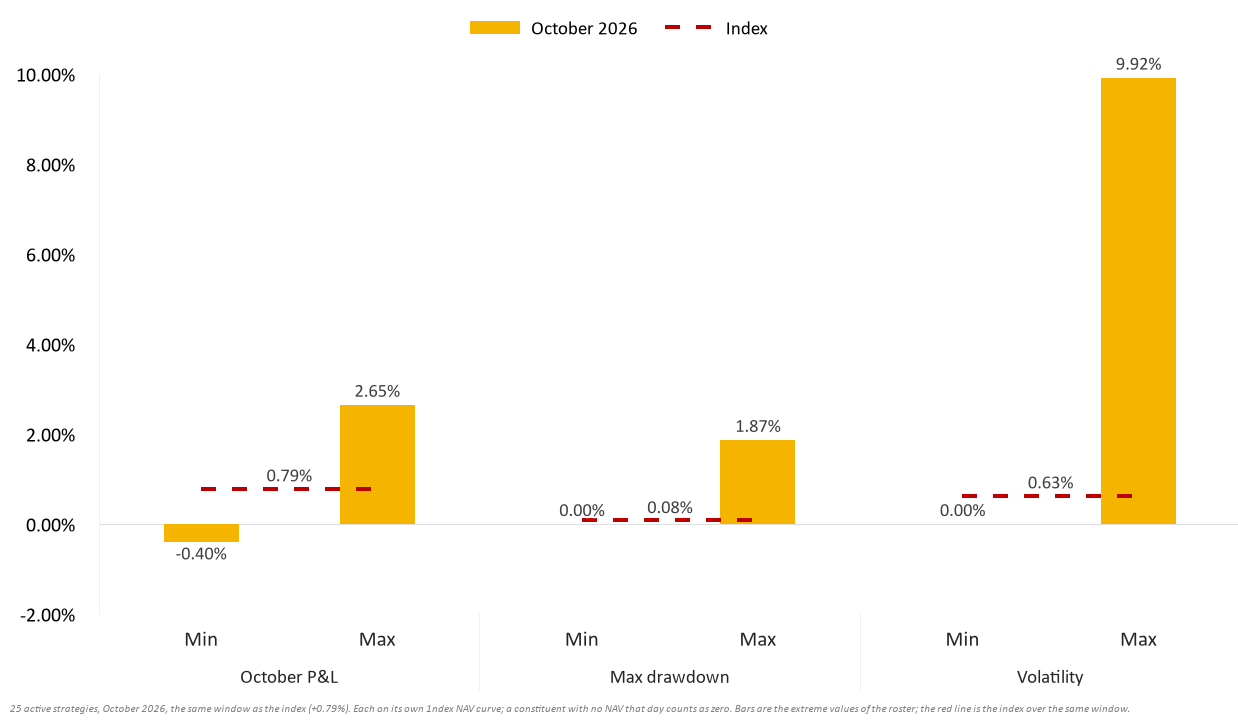
The index returned +0.79%, or +9.44% annualised. Realised volatility was 0.63% and the deepest drawdown 0.08%, from 13 October to 16 October, recovered on 19 October. Twenty-two of the twenty-four strategies made money, one lost and one was flat; the median returned +0.69%, the middle half sat between +0.33% and +1.24%, and the full range ran from −0.40% to +2.65%. Constituent drawdowns ran from zero to 1.87% and volatility from zero to 9.92%. Gross exposure averaged 3.68 times net assets, the highest of the three buckets.
P&L decomposition
Five lines explain October across the six books, each as a share of opening equity: trading, funding, fees, financing and a residual. Together they add to 0.95 points.
Funding was positive in every book, between 0.50% and 1.90% and 1.09% on average. Trading averaged +0.19% and was positive in five of the six; fees took 0.12%, financing 0.27% and the residual 0.07%.
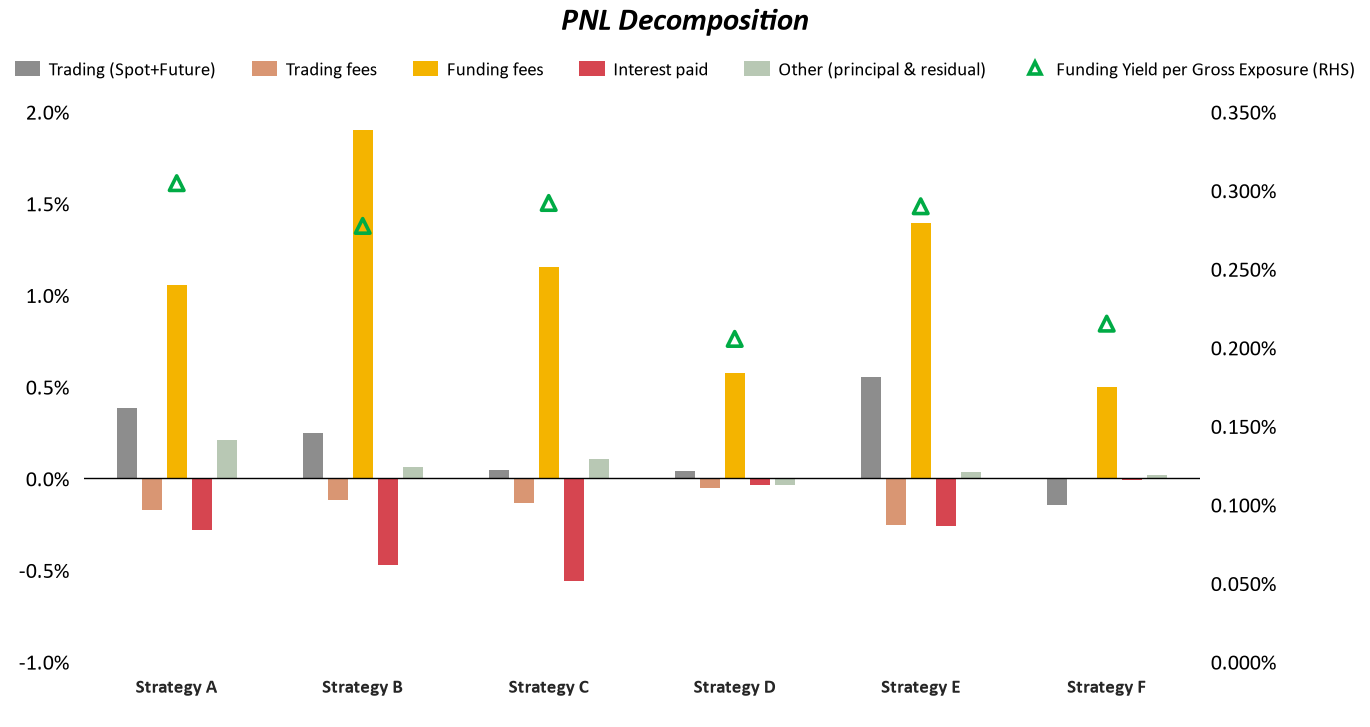
Funding of 1.09% of equity is 13.1% a year. Funding yield per unit of gross exposure (FYpGE) is 0.30% for the month and 3.6% annualised at 3.68 turns, against a 4.2% market rate.
Holdings
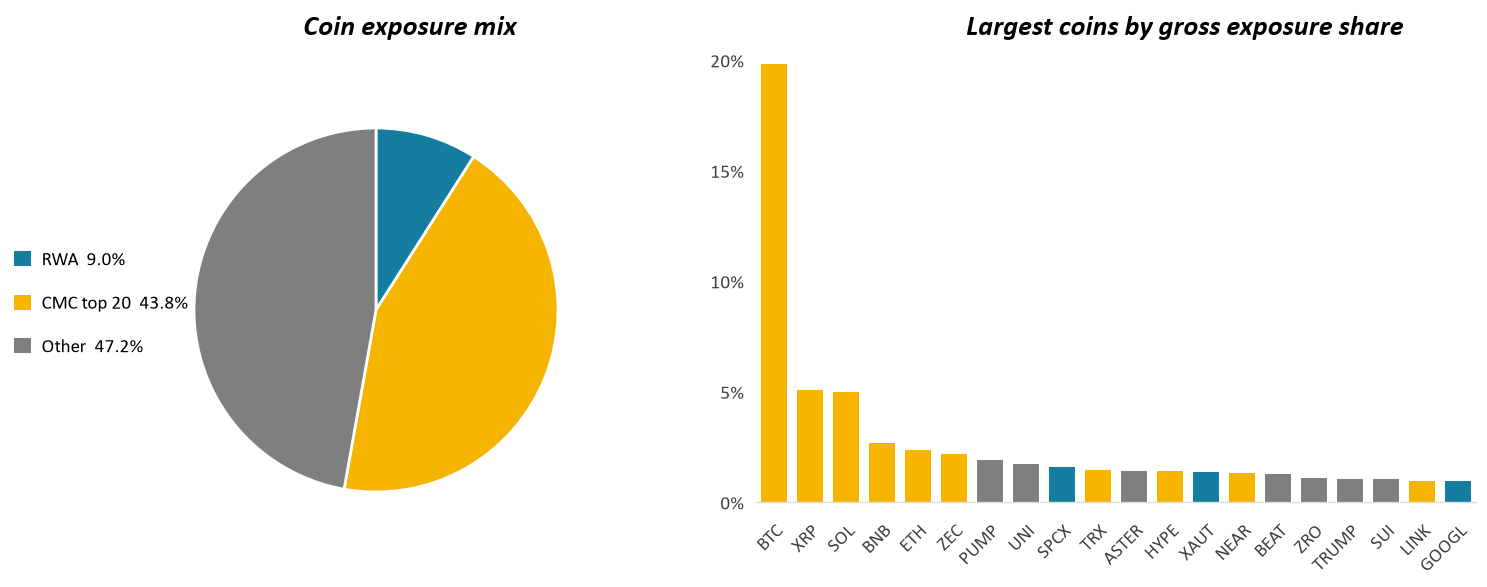
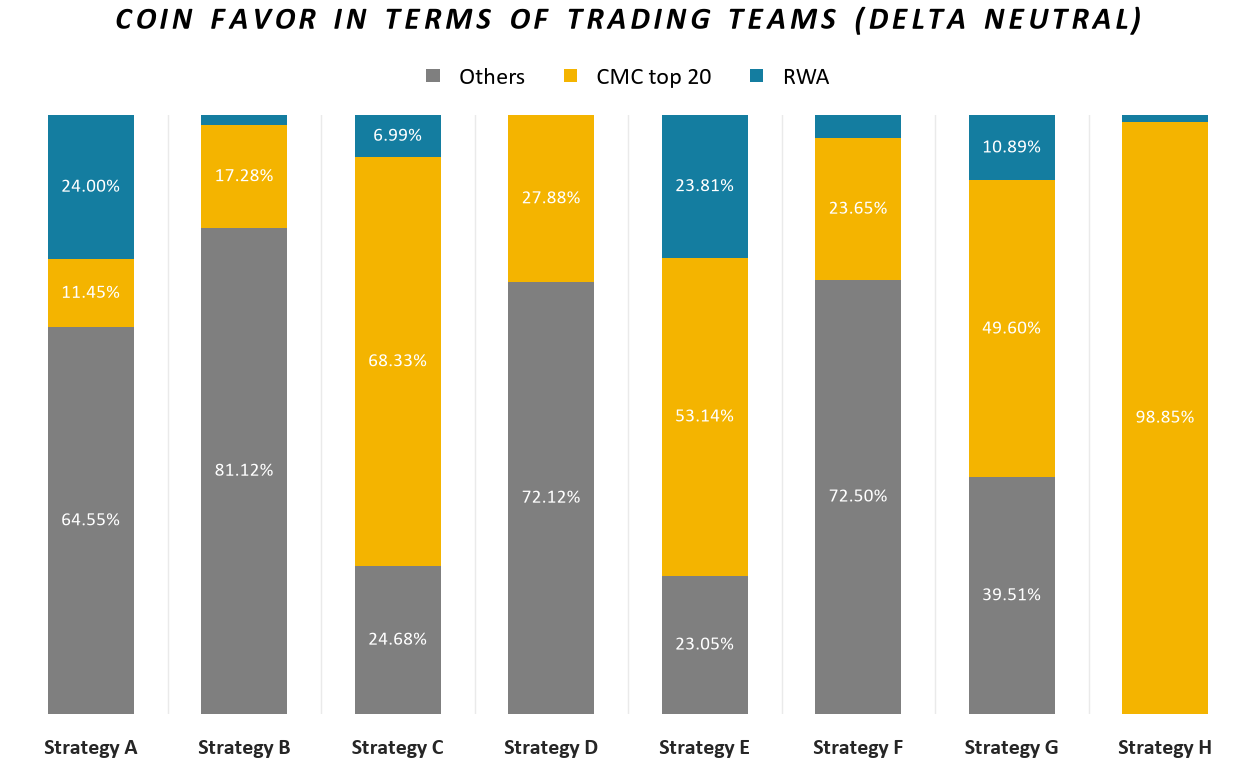
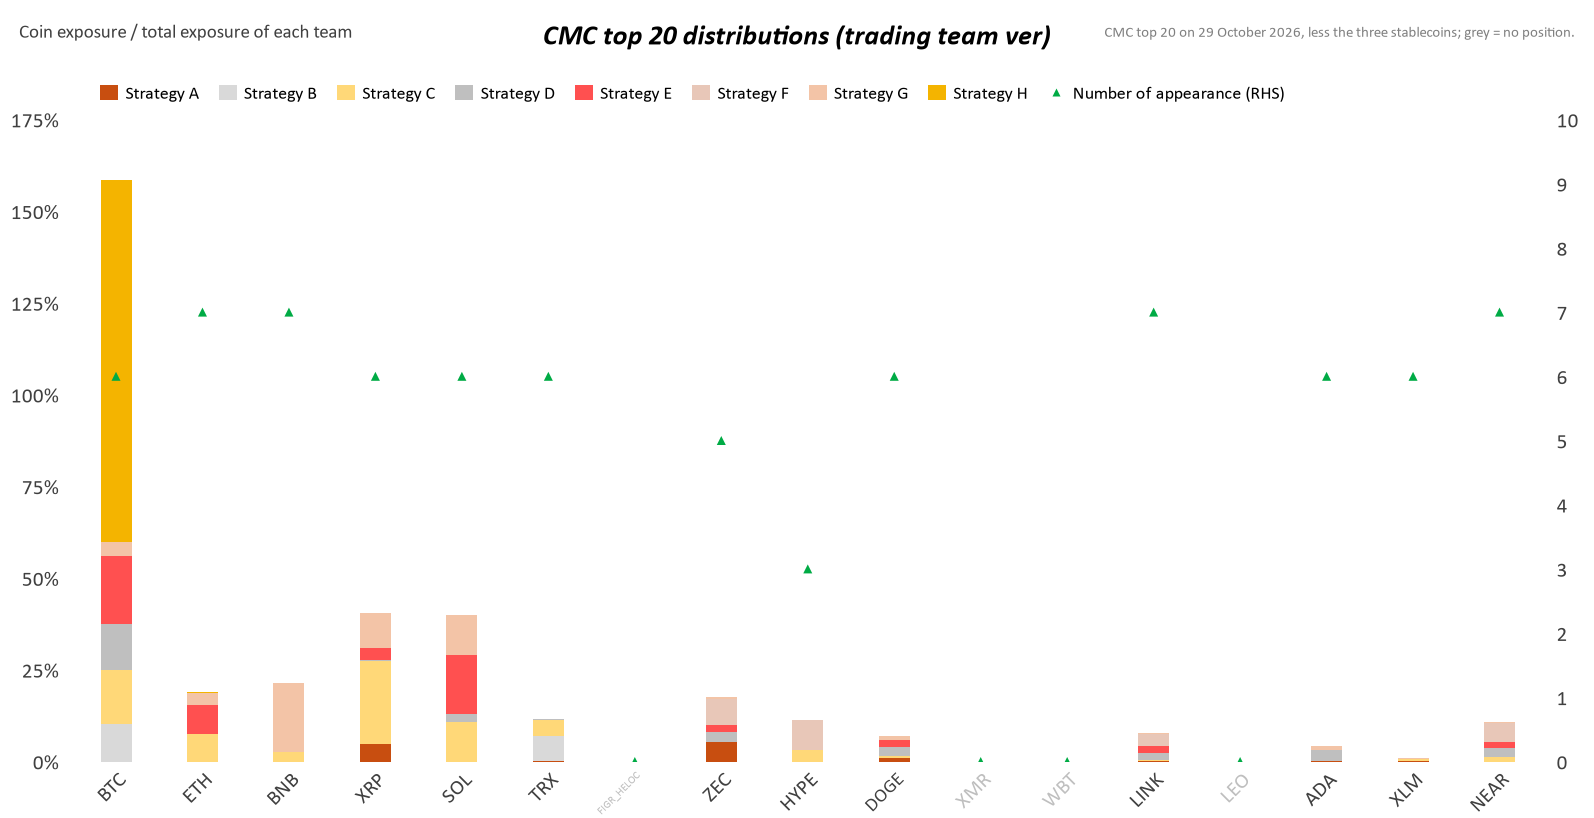
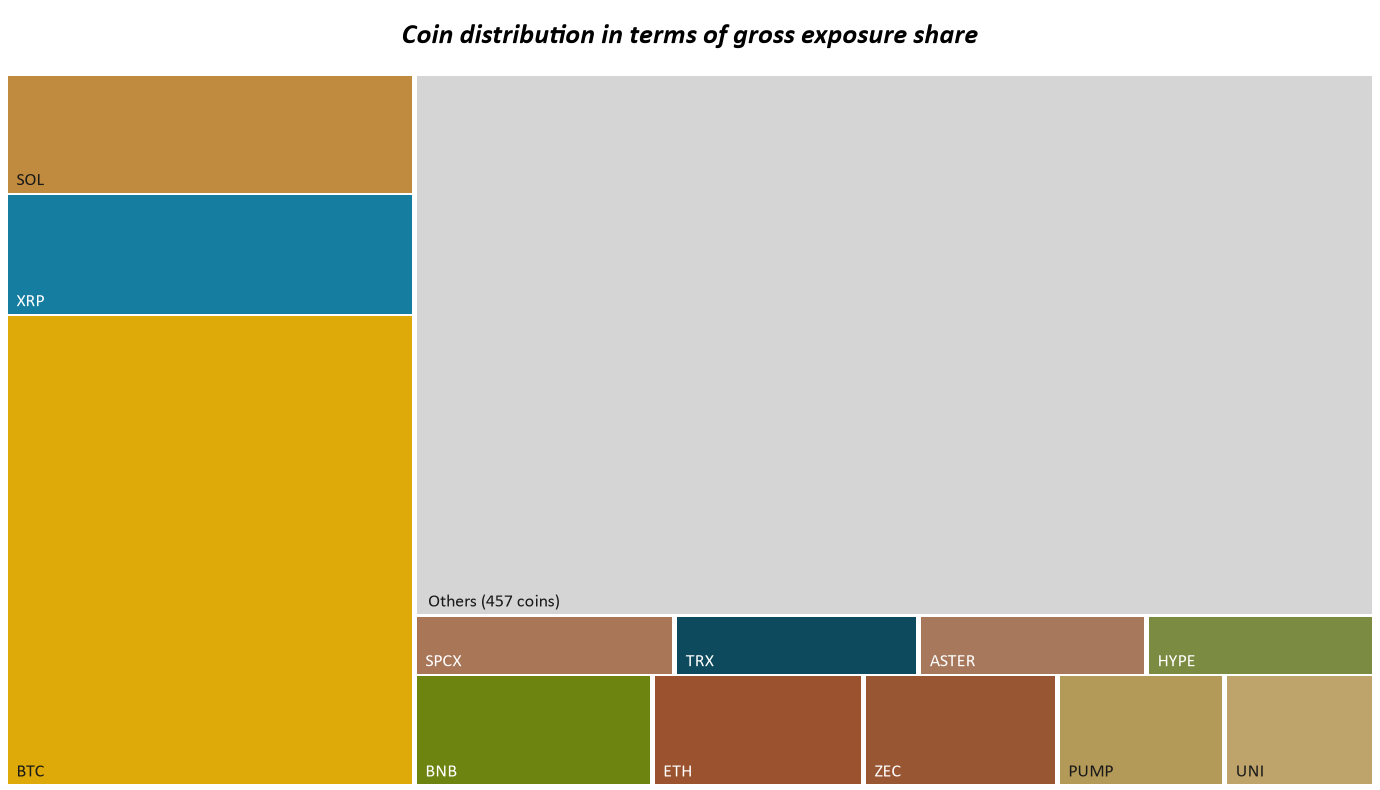
Gross exposure is broad rather than concentrated: CMC top-20 names 43.8%, the tail 47.2% across 457 names, tokenised real-world assets 9.0%. BTC is the largest position at 19.8%, then XRP 5.1%, SOL 5.0%, BNB 2.7%, ETH 2.4%; SpaceX and gold tokens lead the RWA sleeve.
Market Neutral
The index returned −0.48%, or −5.74% annualised. Realised volatility was 3.15% and the maximum drawdown 1.50%, the largest the index has recorded in 2026 and still open at the end of October. Twelve of the eighteen strategies made money and six lost, the median rose 0.34%, the worst fell 5.08% and the best gained 2.62%; volatility ran from 0.48% to 54.43% and drawdown from 0.01% to 18.23%.
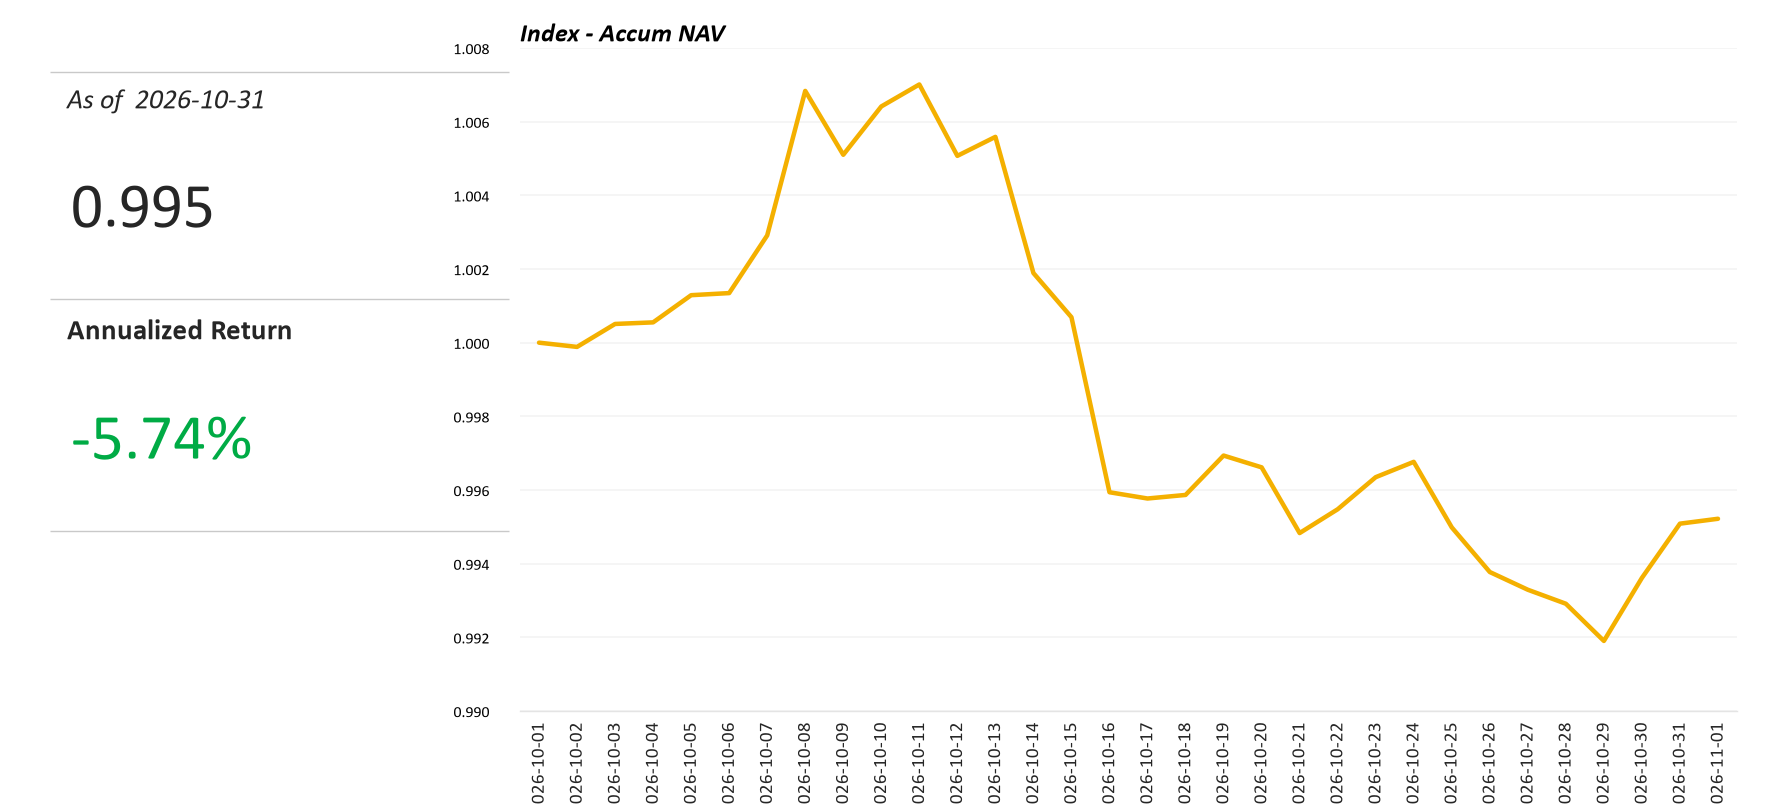
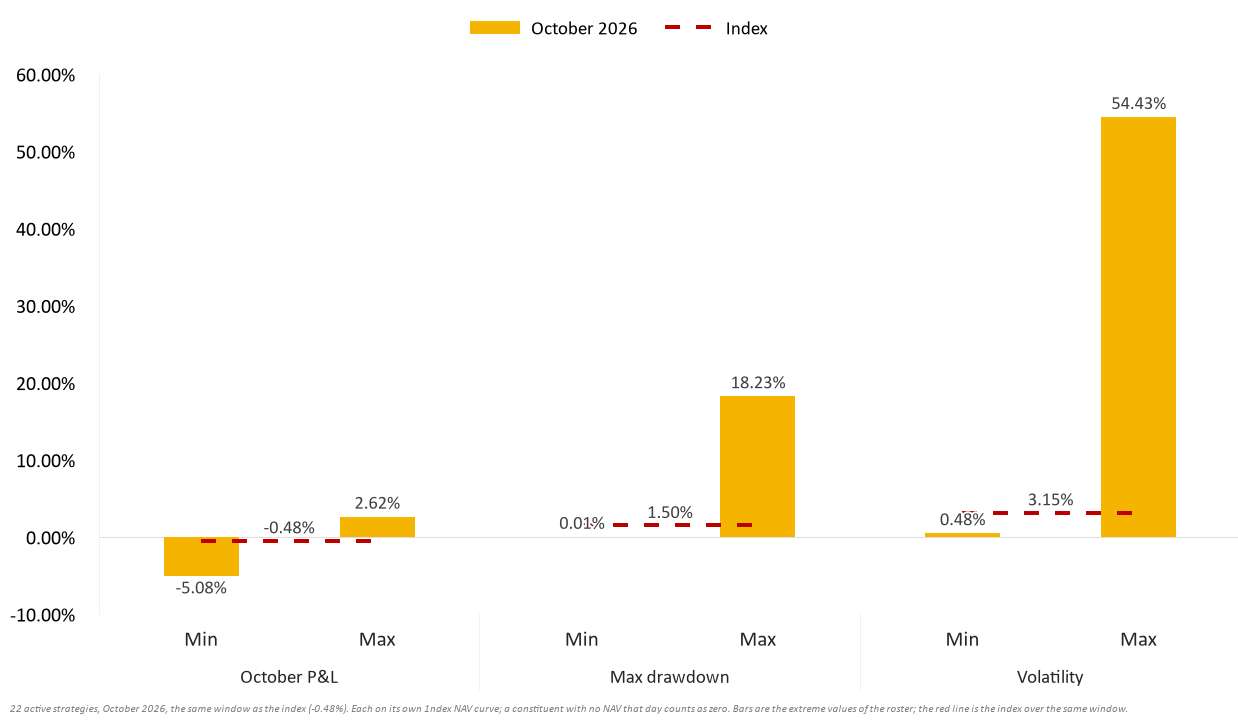
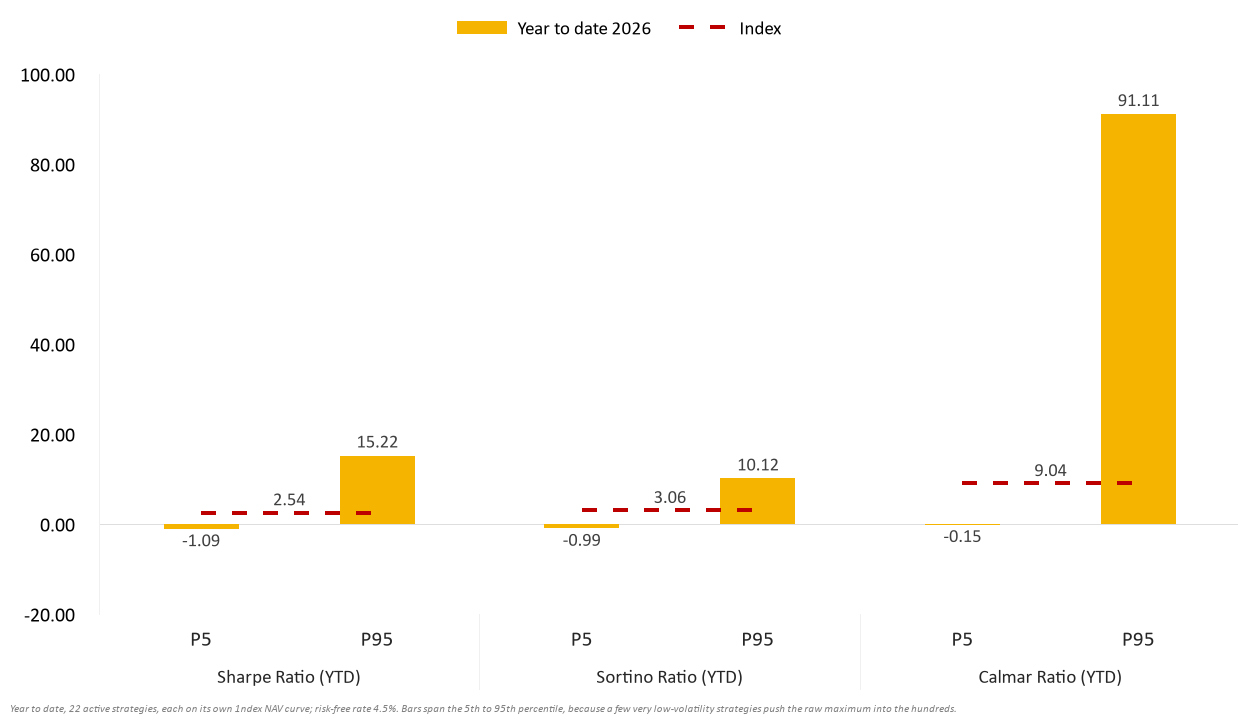
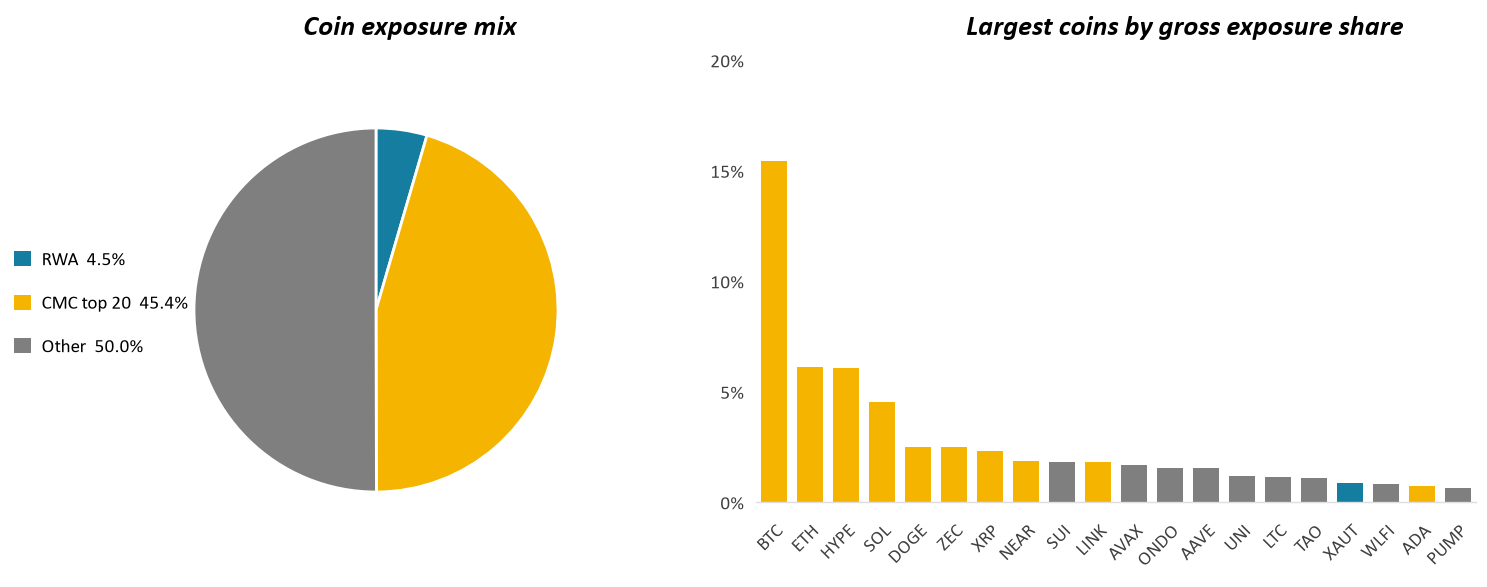
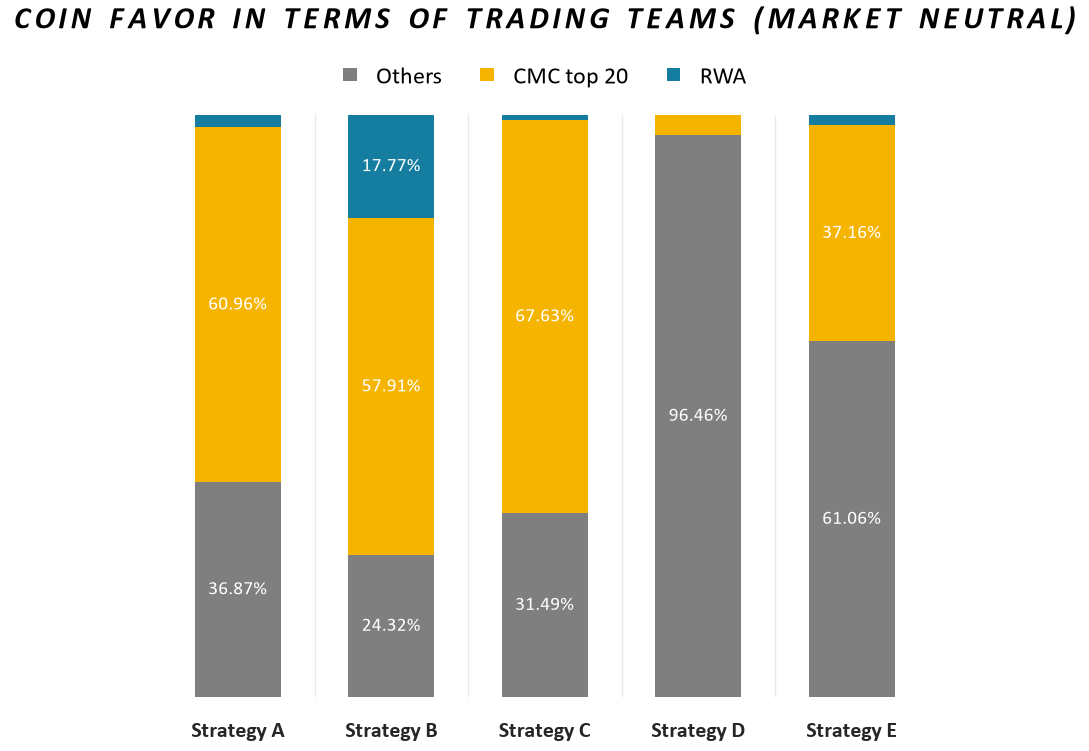
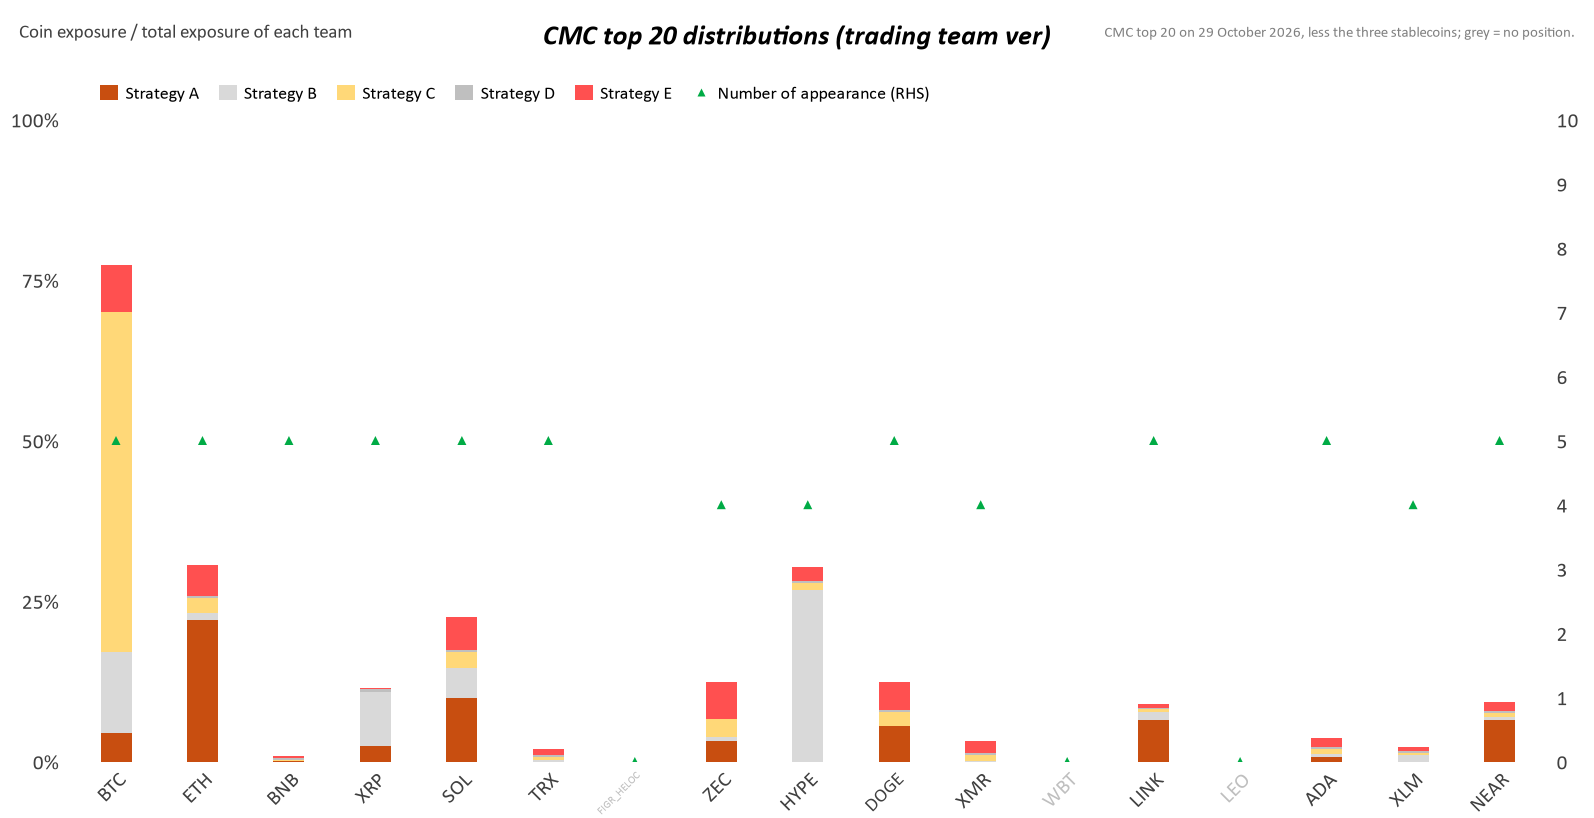
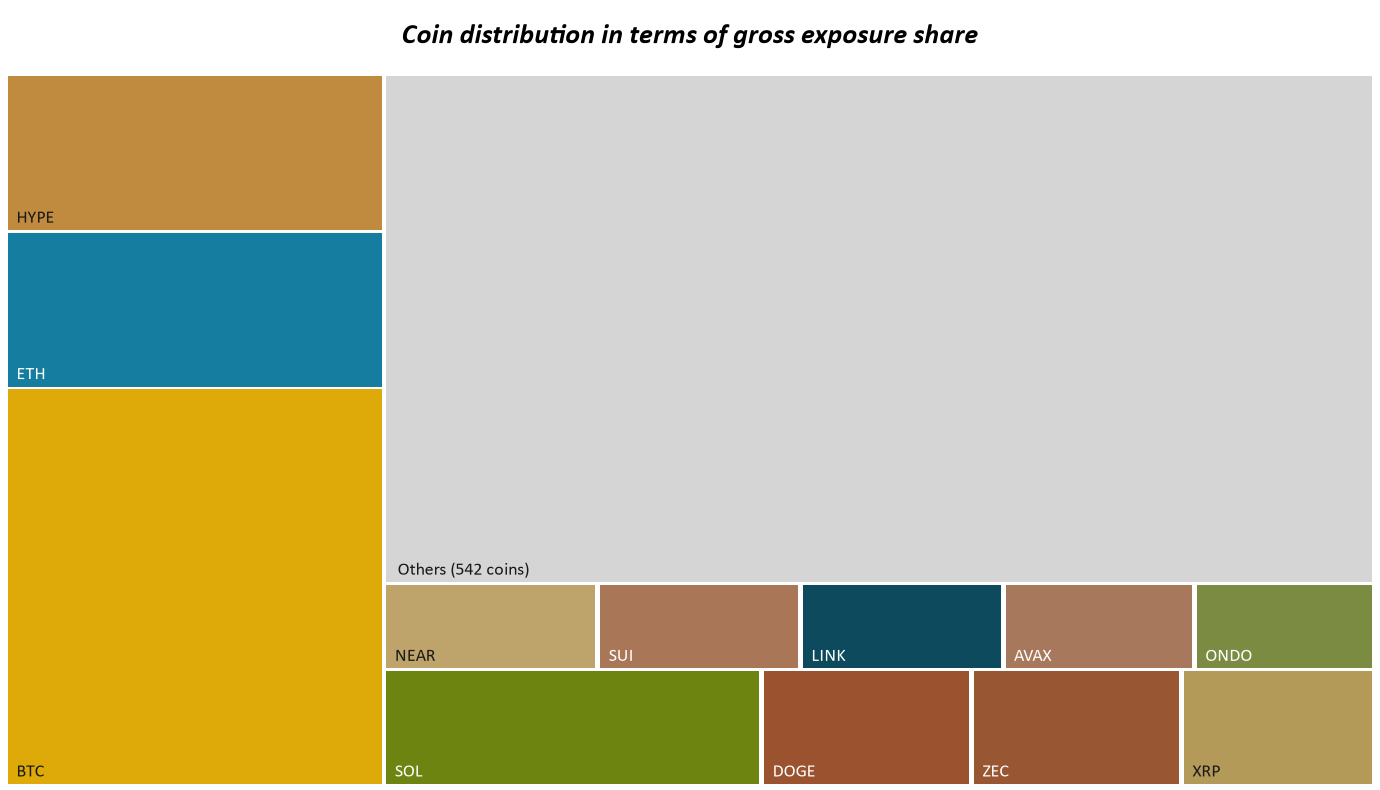
Of an 8.7-point spread between constituents, 6.9 points were specific to the coin rather than to its sector. That is why the index, at −0.48%, sits below a median constituent at +0.34%: losses in the six losing strategies outweighed gains in the twelve winners. CMC top-20 names are 45.4% of gross exposure, the tail 50.0% across 542 names and RWA 4.5%; BTC is 15.5%, ETH 6.1%, HYPE 6.1% and the next four between 2.3% and 4.5%.
Directional
The index returned −1.98%, or −23.74% annualised, with realised volatility of 6.44% and a maximum drawdown of 3.58%, set between 2 October and 18 October and not recovered by the end of the month. Fifteen of the twenty-two strategies lost money and the median fell 2.90%, with three down more than 10% and two up more than 10%; volatility ran from 5.17% to 105.28% and drawdown from 0.57% to 26.55%. The equal-weighted constituent average returned −1.58%, 39 basis points above the index.
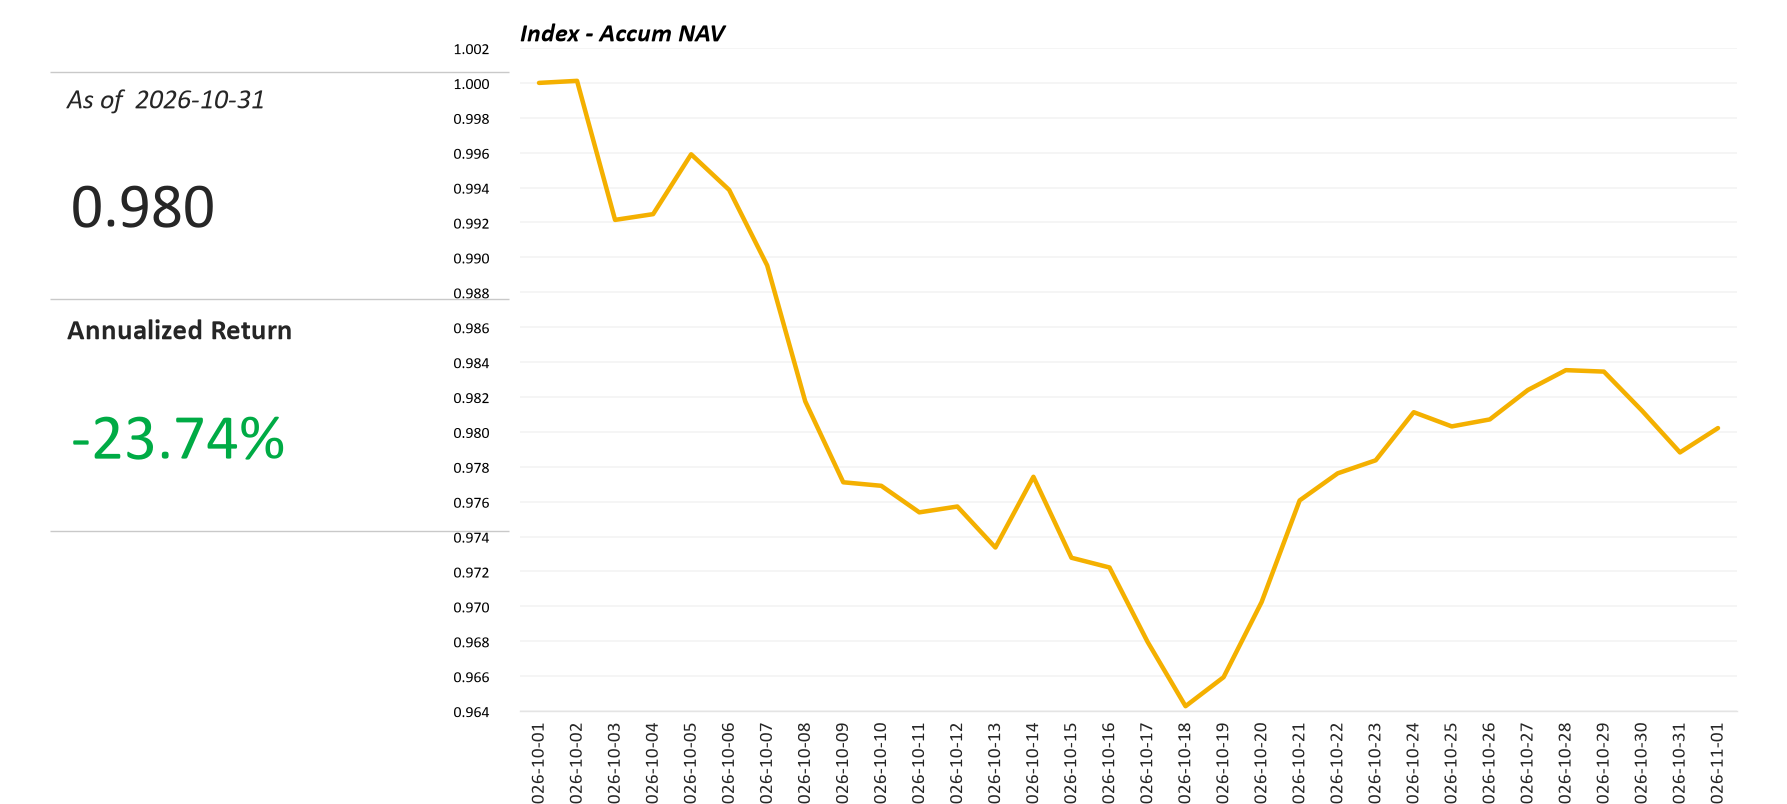
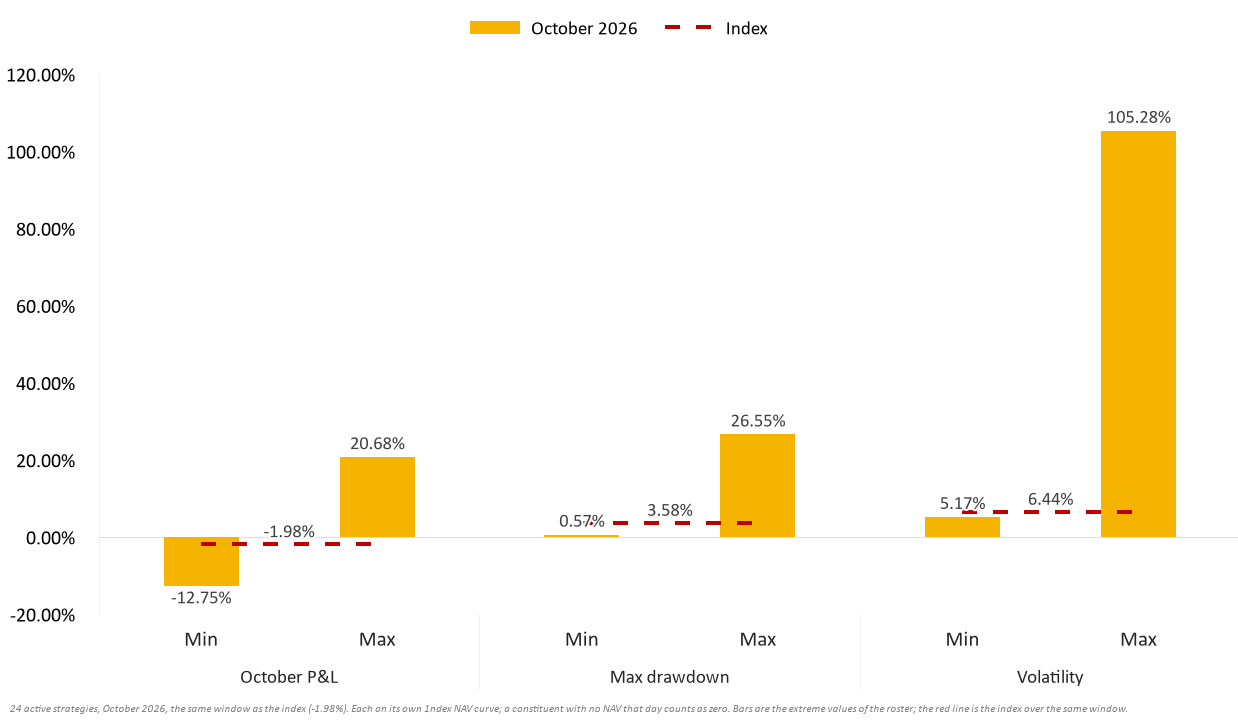
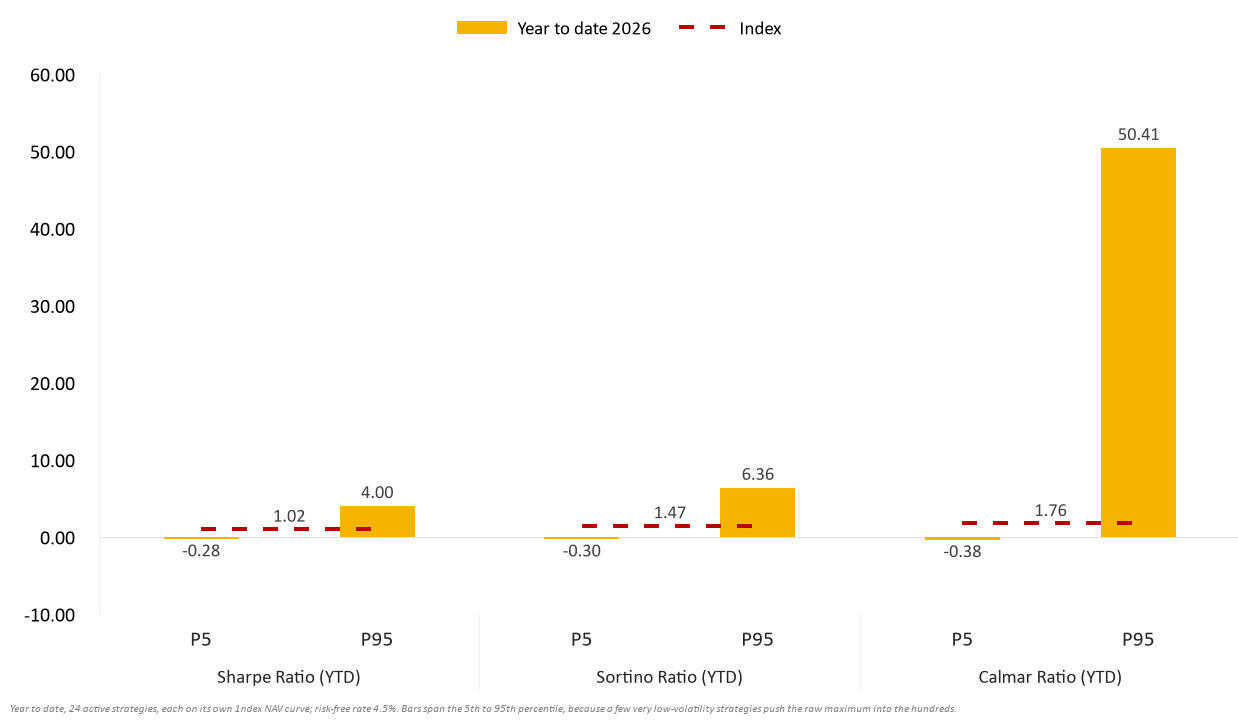
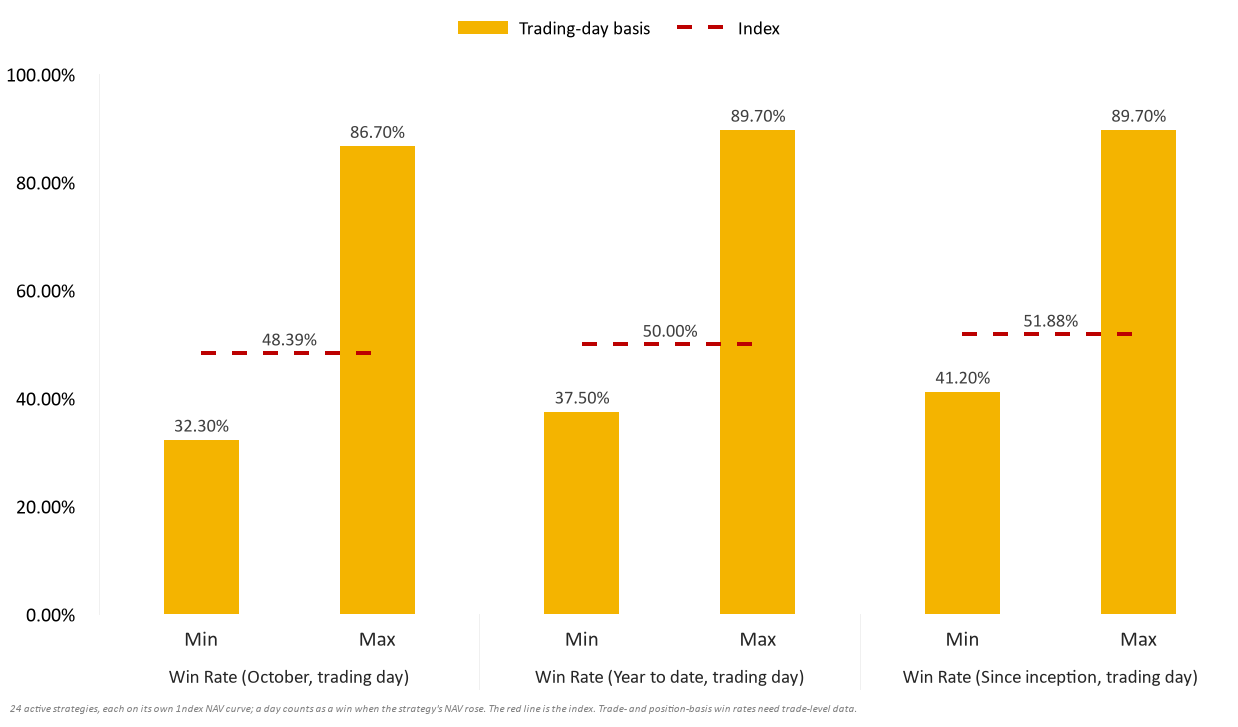
The move was real but not persistent: BTC fell 7.50% without a single day moving more than 4.12%, a steady decline rather than a break.
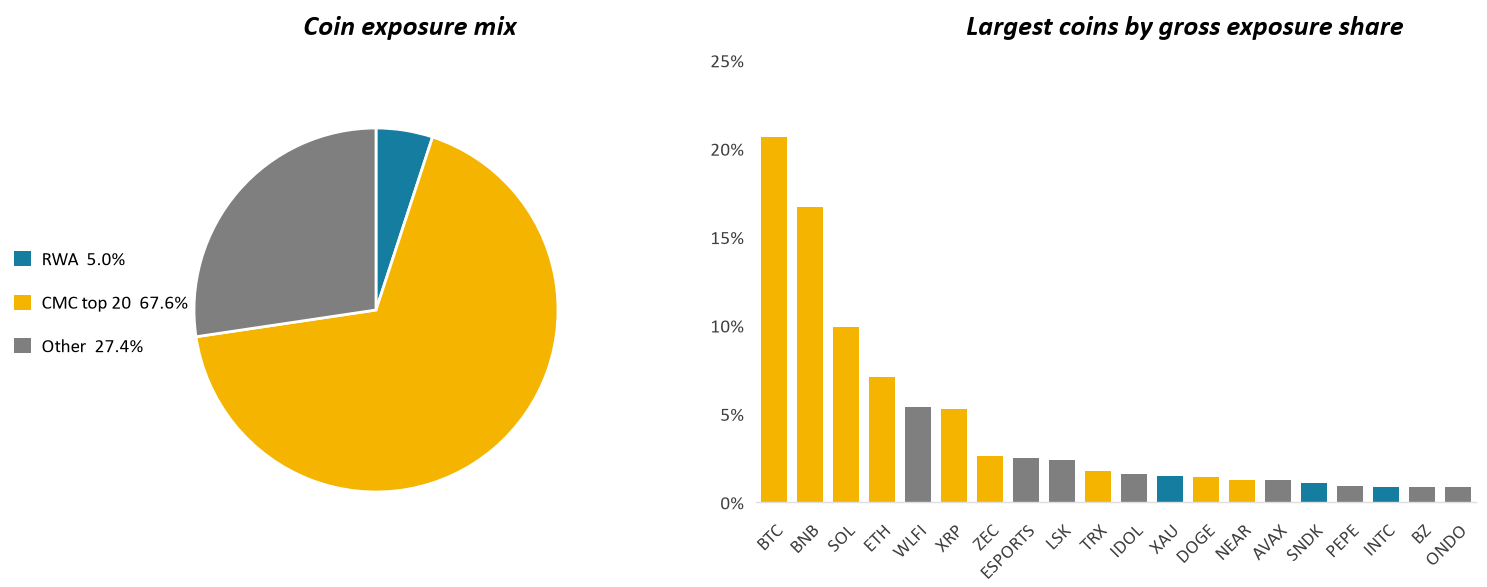
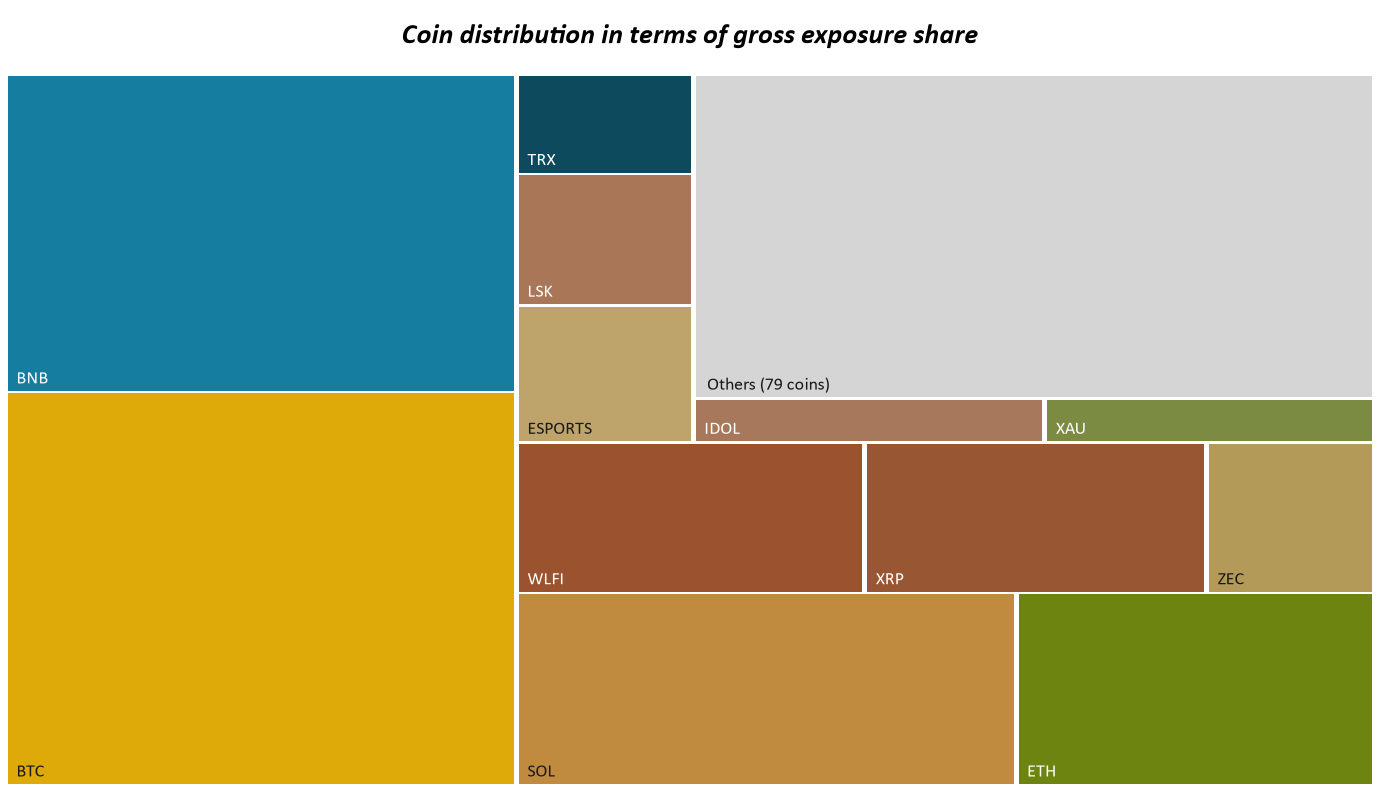
The coin mix is the most concentrated of the three: CMC top-20 names 67.6%, the tail 27.4% across 79 names, RWA 5.0%. BTC is the largest position at 20.7%, ahead of BNB 16.7%, SOL 9.9%, ETH 7.1%, WLFI 5.4%, XRP 5.3%.
Methodology: See Index Formula for full methodology and calculations.
Data and reporting window: Index returns and risk statistics come from 1ndex. CAM supplies net assets, gross exposure, coin mix and Delta Neutral P&L decomposition; these datasets cover overlapping but different populations. The reporting window is 00:00 UTC on 1 October to 00:00 UTC on 1 November 2026. Annualized returns in this issue equal monthly returns multiplied by twelve. The platform rebased its historical indices at the October close; earlier issues stand as published.
Collaboration teams for this study primarily come from Asia. In the future, we hope to expand the diversity of our sample to include teams across various regions around the world. If you'd like to be part of our benchmark study, please feel free to contact our partnership manager at joey.shi@1tokentech.com.
About 1Token
1Token(https://1token.tech/) is a SOC2 Compliant software for institutional Crypto Portfolio, Risk, Operations, Accounting and Lending Management, named Hedgeweek's 2024 "Portfolio Management Solution of the Year", serving 100+ top-tier institutional clients in the crypto industry, including Family Offices, SMA Allocators, Multi-Strategies Trading Funds, DMA Prime Brokers, Asset Managers, Lending Institutions, Fund Admins & Auditors across the US, EU, and APAC, collectively managing over $20 billion in assets.
For general inquiries like authorization requests of the report, product demo, or general collaboration opportunities, please email service@1token.trade.
Disclaimer
The information contained in this report is provided by 1Token for general informational purposes only and does not constitute professional advice. While every effort has been made to ensure the accuracy of the information, no warranty or representation, express or implied, is made regarding its completeness or reliability. The contents of this report reflect the views and opinions of the author(s) as of the date of publication, and may be subject to change without notice.
The reader should independently verify any information or conclusions presented herein before making decisions based on the report. 1Token and any affiliated parties are not responsible for any actions taken or not taken as a result of reading this report.
This report may contain forward-looking statements, estimates, and projections based on current expectations. These statements are subject to risks and uncertainties that could cause actual results to differ materially from those anticipated. 1Token assumes no obligation to update or revise any forward-looking statements.

Comments ()