
1ndex Strategy Index Weekly | 9–15 November 2026
All three 1ndex indices declined in 9–15 November 2026, with losses concentrated in a handful of positions. Weekly performance, component ranges and year-to-date context.

The three indices fell together in the week of 9 to 15 November: −0.75% (Delta Neutral), −0.11% (Market Neutral) and −1.87% (Directional). The spread between the best and worst bucket was 1.76 percentage points. Each bucket had closed the prior week higher. The week is not a broad decline, though; the drag came from a handful of positions at the extremes.
Weekly index performance
| Index | 9–15 Nov | 2026 YTD |
|---|---|---|
| Delta Neutral | −0.75% −38.99% ann. | +10.12% +11.37% ann. |
| Market Neutral | −0.11% −5.75% ann. | +13.51% +15.17% ann. |
| Directional | −1.87% −97.21% ann. | +15.73% +17.67% ann. |
All figures cover 9 to 15 November, Monday to Sunday. The weekly annualised figures multiply the weekly return by fifty-two; they are arithmetic extrapolation of one week, not a forecast, and one losing week extrapolates to a large negative number. The year-to-date figures describe where the indices stand.
Delta Neutral
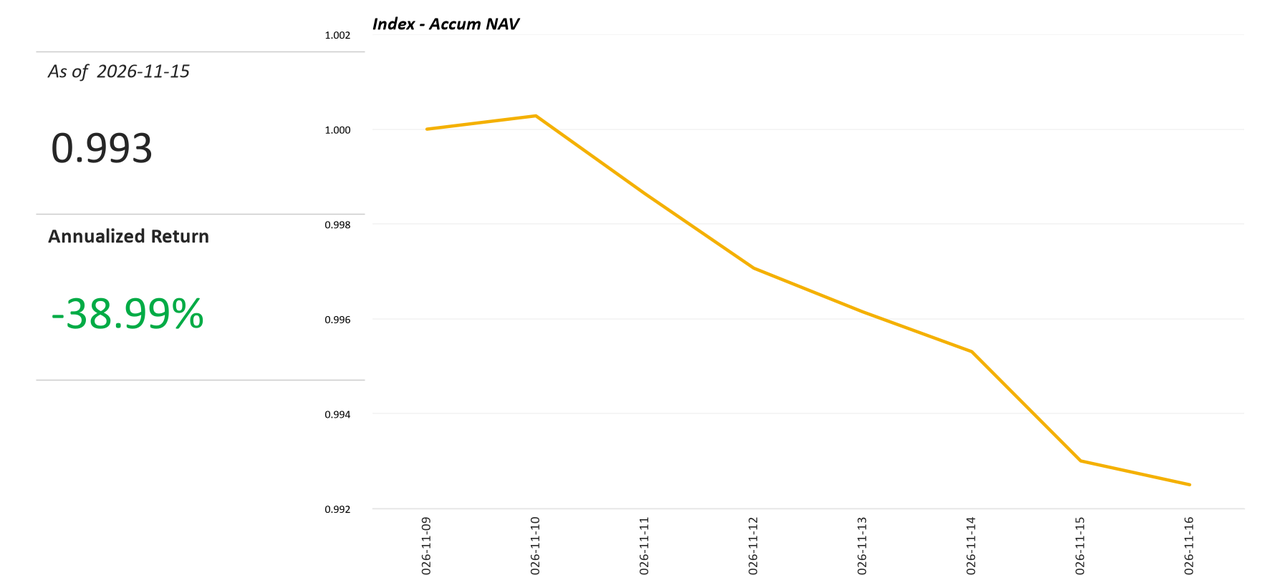
Delta Neutral lost 0.75%, one session up and six down. The widest gain was 9 November at +0.03% and the deepest loss 14 November at −0.23%. Volatility of 1.63% annualised is the lowest of the three and the index drew down 0.78% from its peak inside the week.
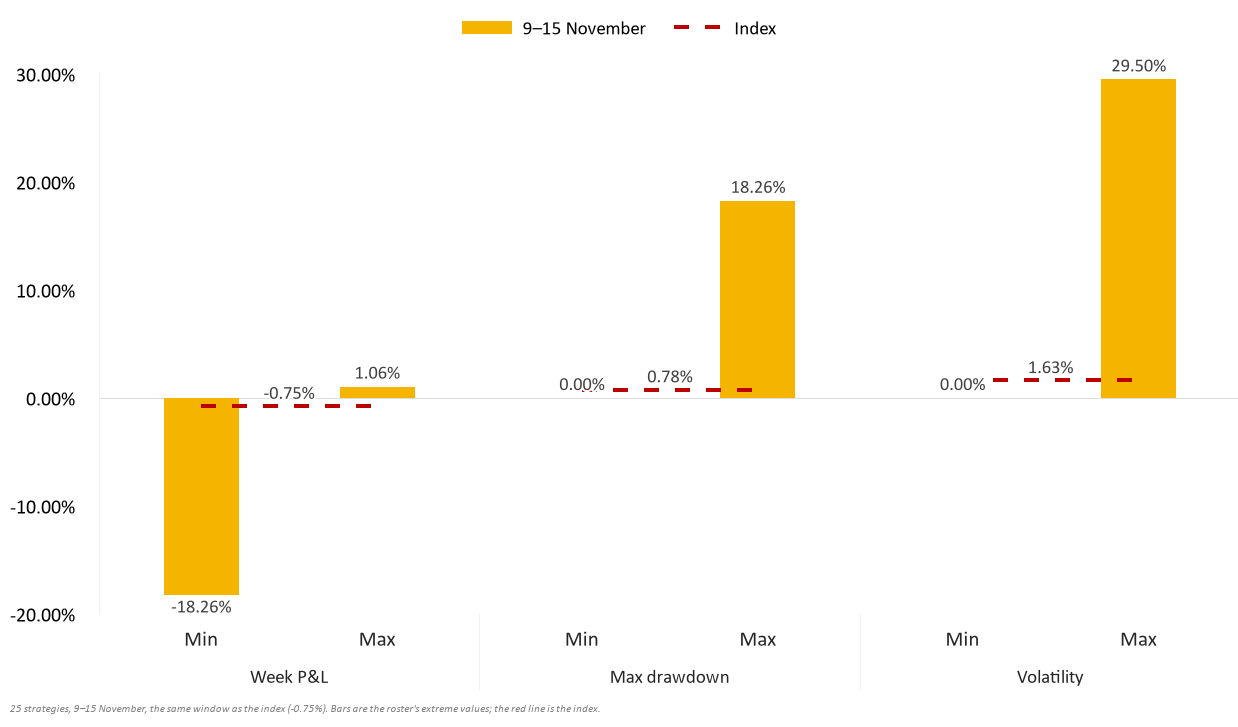
One position sets the range. A single-venue arbitrage book on one exchange fell on each of the seven sessions, to −18.26%, while the same team's other vehicles on separate venues closed higher, the best of them at +1.06%, the top of the bucket. The index holds them at equal weight, so the loss reaches the composite while the typical member does not follow it down.
Market Neutral
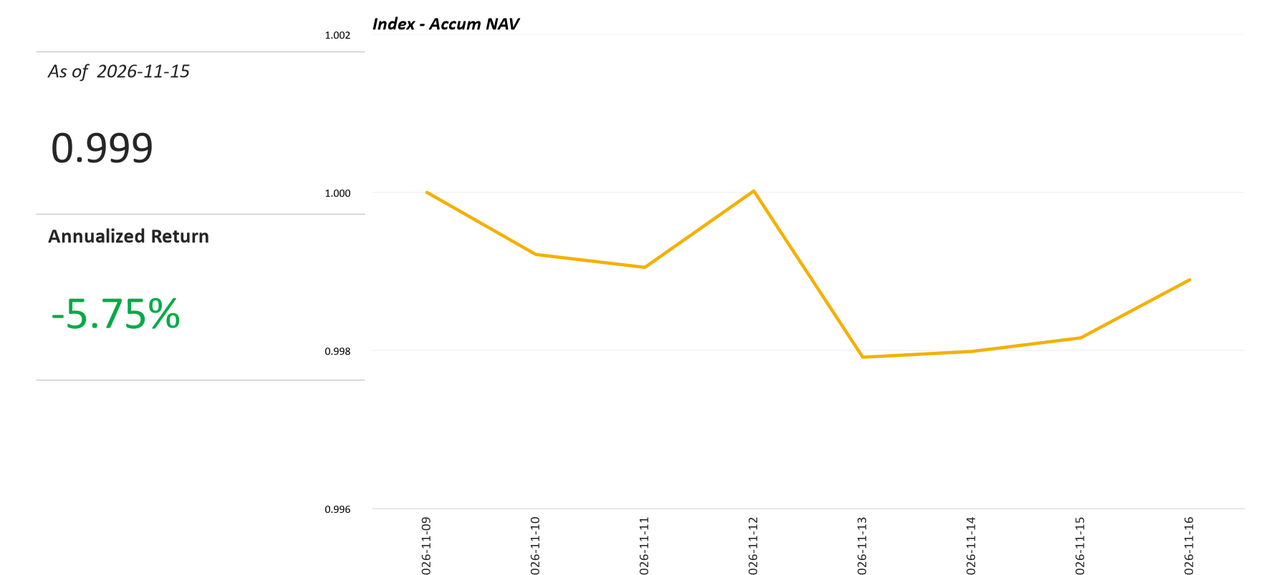
Market Neutral lost 0.11% on four up sessions and three down. The best day was 11 November at +0.10%, the worst 12 November at −0.21%. Annualised volatility was 1.97%, while the 0.21% drawdown was the smallest of the three.
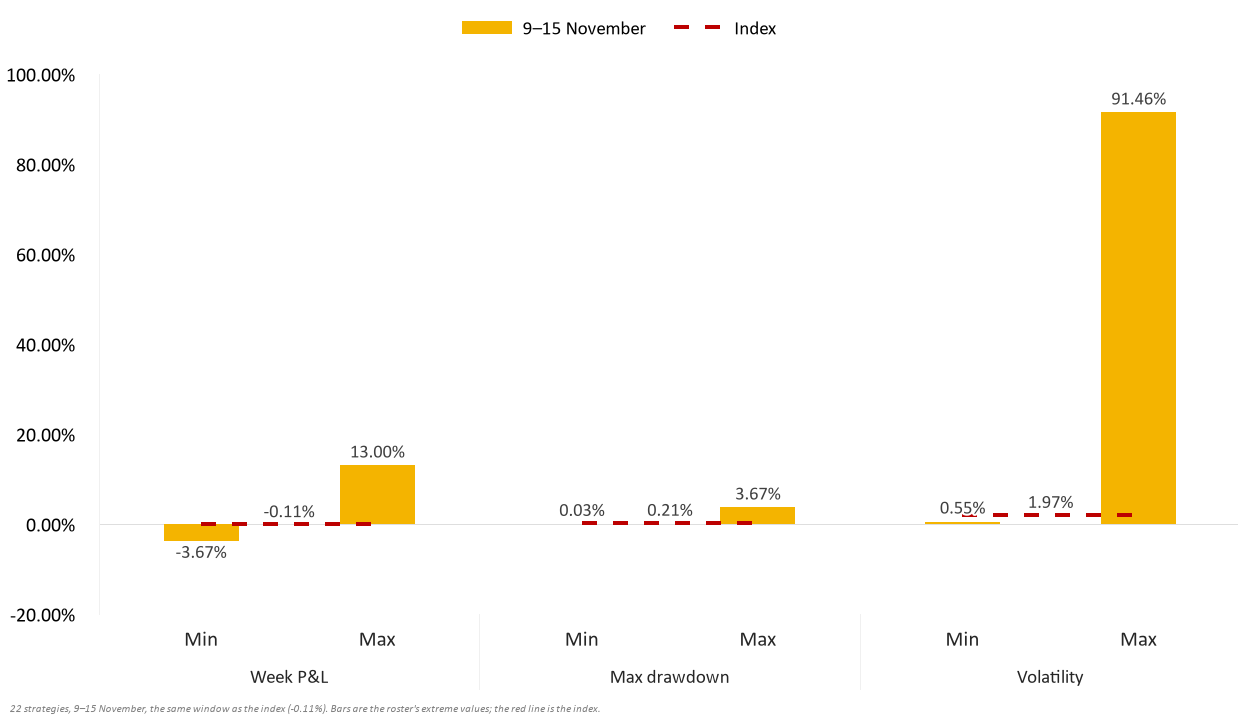
The range runs from −3.67% to +13.00%. The high end is a book carrying 91.46% annualised volatility for its 13.00% week; the low end lost 3.67%. Equal weighting dampens both.
Directional
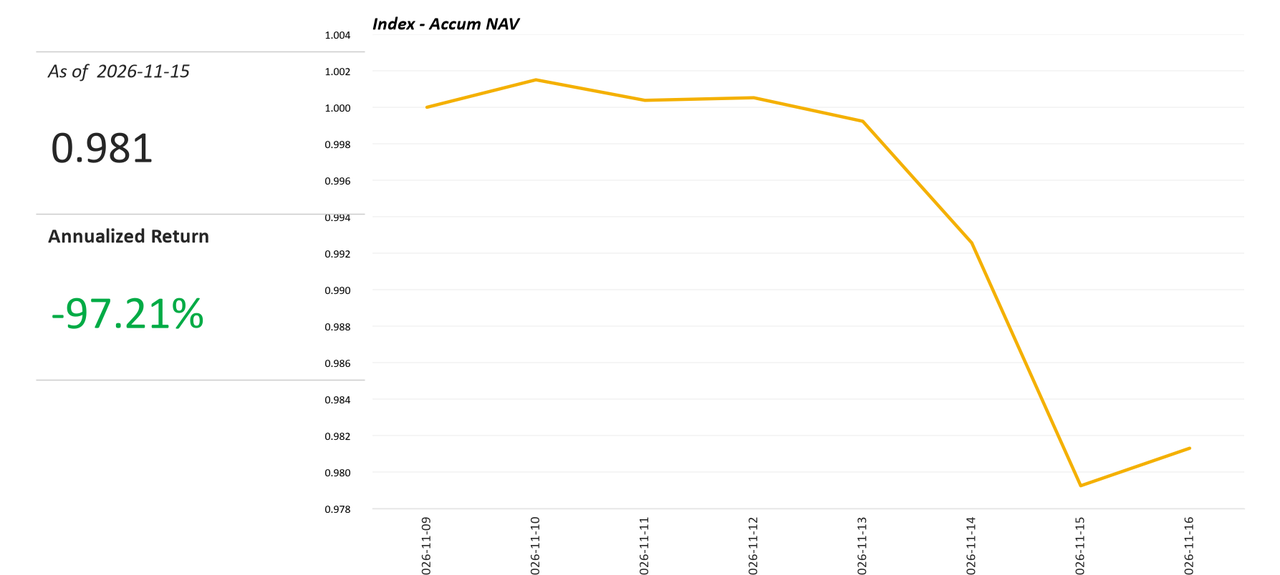
Directional lost 1.87%, three sessions up and four down. The best day was 15 November at +0.21%, the worst 14 November at −1.34%. Volatility of 10.58% annualised is more than five times Delta Neutral's and the 2.22% drawdown is the deepest of the three.
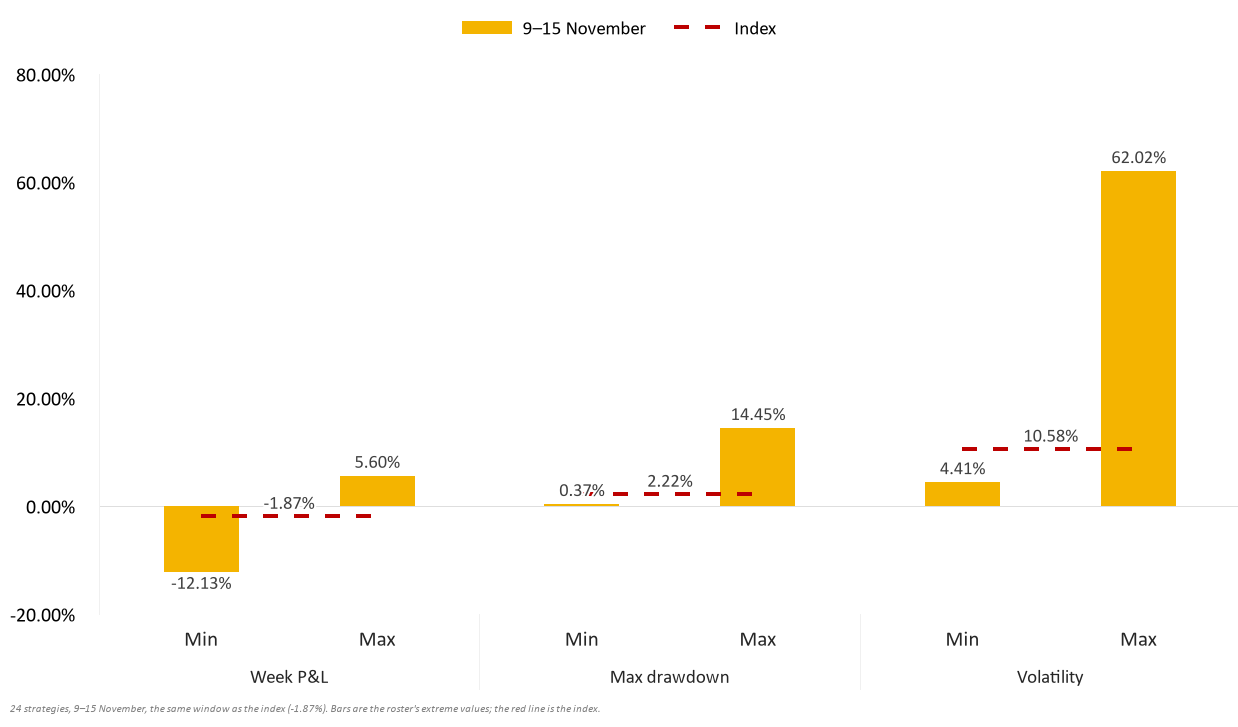
The bucket's range is −12.13% to +5.60%, and volatility reaches 62.02% annualised at the high end against a bucket figure of 10.58%. The widest drawdown inside the roster is 14.45%. Four of the twelve strategies with a NAV in the window were positive, so the week is a left tail rather than a rotation.
Where the year stands
Year to date the three sit at +10.12%, +13.51% and +15.73%, or +11.37%, +15.17% and +17.67% annualised. Daily correlation between Delta Neutral and Market Neutral was −0.29 over the week, so the neutral pair did not move as one; Delta Neutral to Directional was 0.66, the highest of the three pairs, and Market Neutral to Directional −0.07. Directional stays the strongest on the year despite the weakest week.
Method
Each index is an equal-weighted composite of the active strategies in that direction on 1ndex, rebased to 1.000 at the start of the window. Returns carry no fee, financing or risk-free deduction. Volatility is the standard deviation of daily returns annualised over 365 days; drawdown is peak to trough inside the stated window. Component bars show roster extremes against the index; the index weights, the median counts.
Explore strategy performance, risk metrics and team profiles on 1ndex.



Comments ()