Strategy Index: Long Short I and Funding Arb II
Drawing on real trading data from 11 crypto trading teams managing over $2B, 1Token’s latest benchmark research provides actionable insights and in-depth analysis of Funding Arbitrage and Long Short strategies for Q1 2025, among the most prominent trading approaches in the cryptocurrency market.
Executive Summary
This report presents an index benchmark analysis developed by 1Token in collaboration with 11 crypto trading teams. Among these partners, eight teams contributed Funding Arbitrage strategies, and seven teams (with some overlap) provided Long Short strategies.
The comprehensive study evaluates two distinct strategy indices for Q1 2025, delivering key insights into both Funding Arbitrage and Long Short strategy performance metrics, such as period returns, maximum drawdown, unit leverage returns, and asset concentration, aiming to provide a reference for the market.
Parameters
- Quote source: CMC
- Granularity: Daily
- Index start time: January 1st, 2025 at 00:00 UTC
- Cut-off-time: 0:00 UTC+0
- Sample Exchange Distribution: Binance, OKX, Bybit
- Accum. NAV calculation method: TWR (Time-Weighted Return)
- Risk-free rate: 3%
- Daily Minimum Acceptable Return (MAR): 0
Note: The selection of the exchanges - Binance, OKX and Bybit - may influence overall performance, as these platforms have different mechanisms such as fees, commissions, and slippage. This report does not take the mechanism difference into consideration, assuming no confounding variables affect the comparison.
Index
Calculation method
We have retrieved the assets of multiple crypto trading teams to the same starting point (January 1st at UTC 0) utilizing a historical retrieving mechanism, calculating the accumulated NAV for each team using the TWR (Time-Weighted Return) measure, and then taking the arithmetic mean to derive an index benchmark that represents the market’s Long Short strategy.
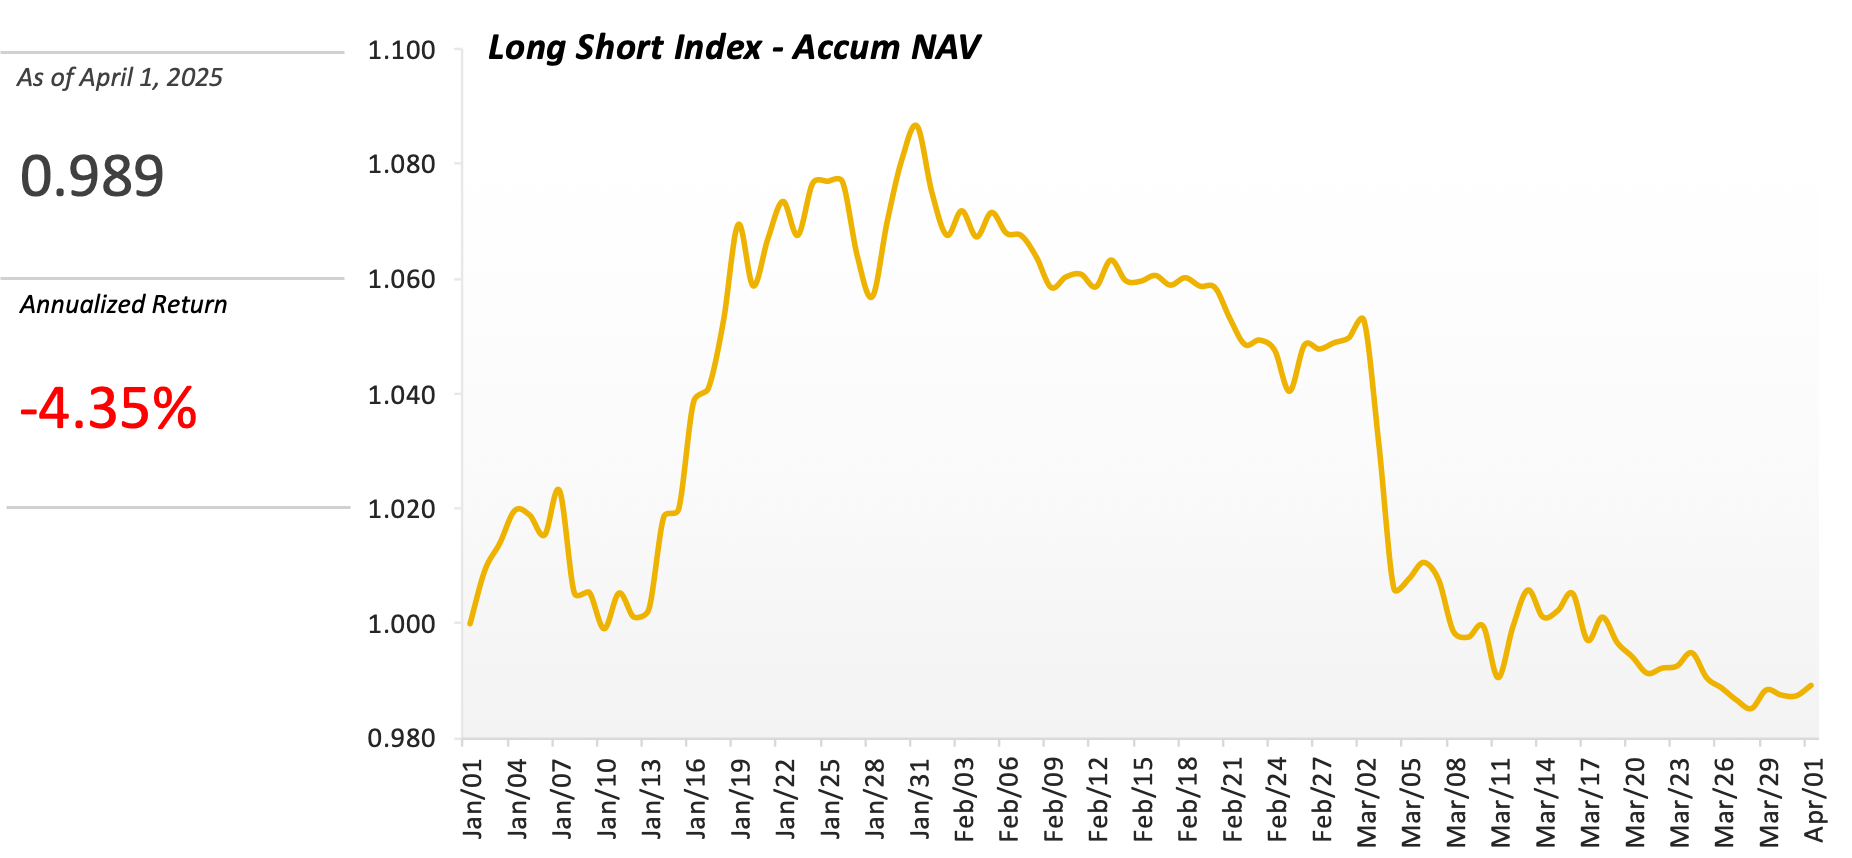
Note: We use the arithmetic mean instead of the weighted average because the current sample size is relatively small, as weighted averages cannot accurately reflect actual team weights. Therefore, the impact of principal has been normalized.
Indicators
The cryptocurrency market saw a correction in Q1 2025 following Q4 2024's rally, as global policy uncertainty weighed on investor sentiment.
Given the diversity of long-short strategies, this report provides a comprehensive analysis across four key dimensions—returns, risk exposure, strategy characteristics, and coin distributions—to offer market insights.
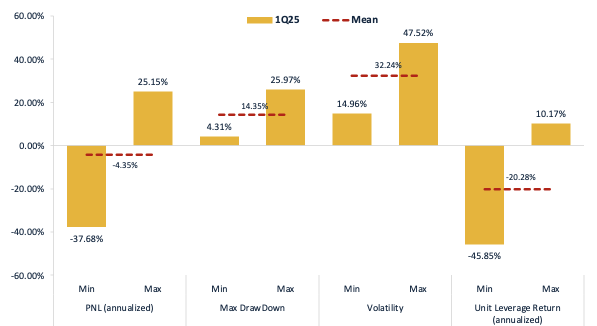
Profit and Loss (PNL) and Risk
Note:
- PNL is calculated based on TWR; Max DrawDown, Volatility and Unit Leverage Return are calculated based on daily data.
- Volatility measures annualized fluctuations of daily PnL% (for portfolios) and daily price fluctuations (for benchmarks). Higher volatility indicates greater risk.
- We calculated volatility with formula STDEV(Daily PNL%)*SQRT(365)
- Unit leverage return refers to the additional return generated by each increment of leverage when making an investment using leverage. We calculated unit leverage return using daily PNL / daily leverage / daily principal
- We use gross exposure % as leverage, with the formula: Gross exposure % = Total Gross Exposure / Portfolio Net Asset; Total Gross Exposure = SUM(Gross Exposure by Underlying excluding stable and fiat coins)
We further assessed risk-adjusted performance through Sharpe Ratio (measuring return per unit of total risk), Sortino Ratio (focusing specifically on downside risk), and Calmar Ratio (evaluating returns relative to maximum drawdown), providing a comprehensive framework to gauge strategy effectiveness across varying market environments.

Note:
- Sharpe Ratio is calculated using 3% of risk free rate; A higher Sharpe ratio indicates better risk-adjusted performance
- Sortino Ratio is calculated using the minimum acceptable return (MAR) equal to 0
- Sharpe Ratio = [Period Avg PNL %(Annualized) - Risk-free Rate] / Volatility
- Sortino Ratio = [Period Avg PNL %(Annualized) - Risk-free Rate] / Downside Deviation
- Calmar Ratio = [Period Avg PNL %(Annualized) - Risk-free Rate] / Max DrawDown
Strategy Features
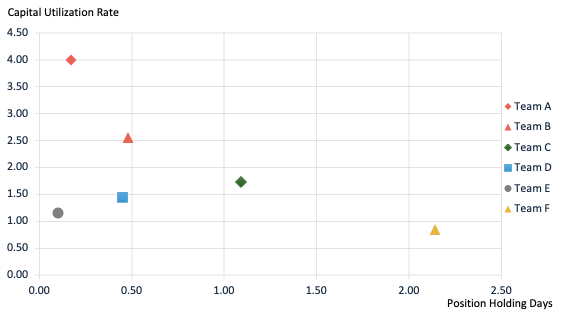
This section introduces two key liquidity metrics for Long Short strategy evaluation: Position Holding Days and Capital Utilization Rate.
👍 Position Holding Days serves as a key metric for evaluating capital efficiency. In this report, we calculate quarterly turnover days by:
- Aggregating absolute value of net USD exposure per symbol from daily cut-off-time snapshots
- Eliminating dual-position interference
- Normalizing against total trading volume
Key characteristics:
- Inverse relationship with liquidity: Lower turnover days indicate higher strategy liquidity
👍 Capital Utilization Rate further complements this analysis by measuring:
- USD Trading Volume: Aggregated from transaction quantities, execution prices, and quote currency exchange rates
- Active Trading Days: Counts the actual number of days with executed trades during the measurement period
- Daily Average Net Assets: Computes the mean net asset value (NAV) across all trading days in the period
Key characteristics:
- Liquidity indicator: Higher ratios reflect more efficient capital deployment
The multi-team dataset analysis reveals that long-short strategies exhibit superior liquidity performance, as demonstrated by consistently shorter position turnover cycles and higher capital utilization rates. The results across both metrics provide robust evidence for the liquidity benefits inherent to long-short strategy structures.
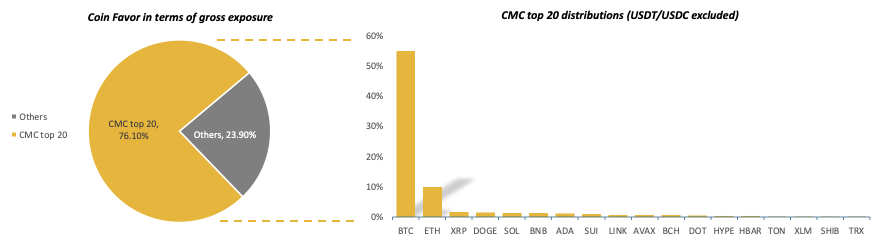
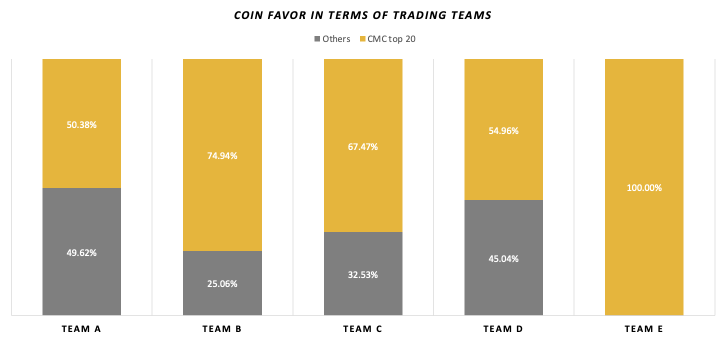
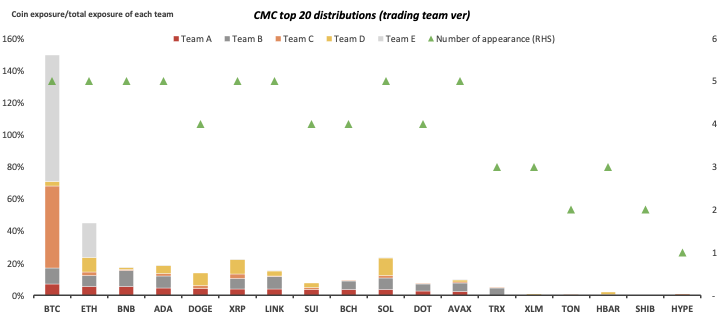
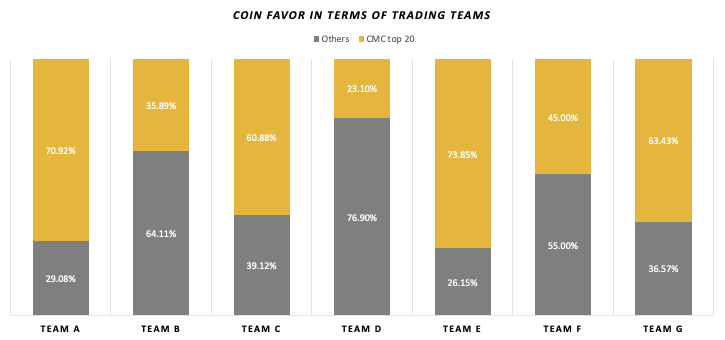
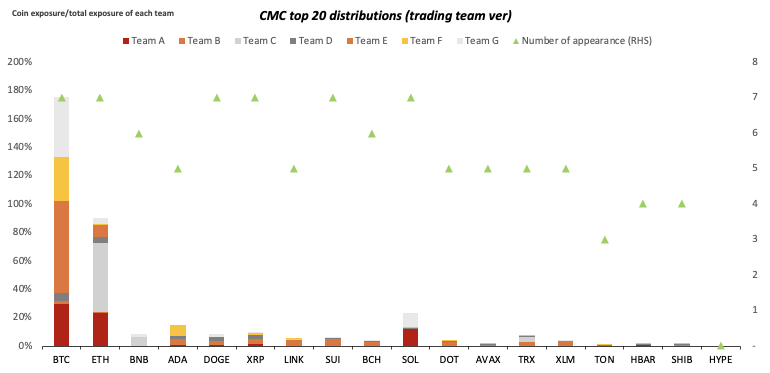
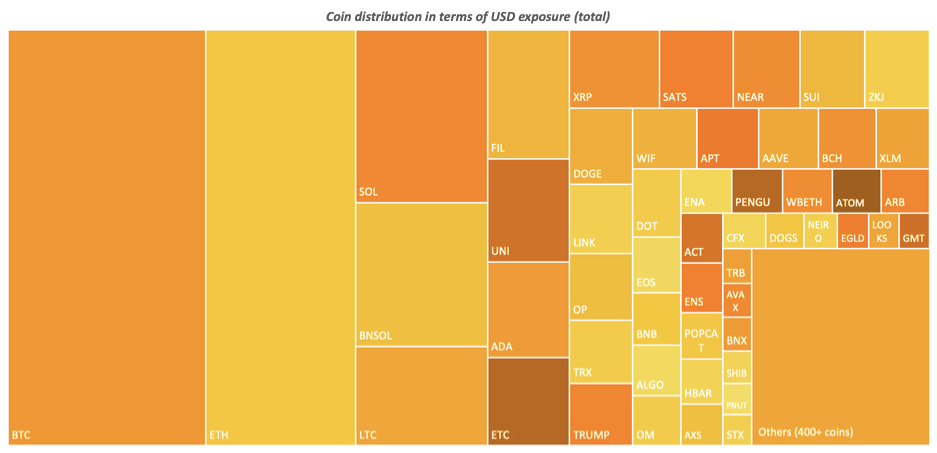
Coin Distributions
We have combined daily snapshot data from trading teams to summarize the asset positions from January 1st, 2025, at 00:00 UTC to April 1st, 2025, at 00:00 UTC, and aggregated the USD exposure for each underlying currency based on the underlying assets.
Note:
- USD exposure = Delta * Underlying Price
- We calculated the distribution ratio using each coin's gross exposure divided by total gross exposure.
- We summarized the data based on underlying currencies and normalized the impact of principal.
To assess the dispersion across coins, we defined the aggregation degree β (ranging from 0 to 1). When β is closer to 1, it indicates that the investment is more concentrated in a few coins, while when β is closer to 0, it indicates that the investment is more diversified.
Index
Calculation method
We have retrieved the assets of multiple crypto trading teams to the same starting point (January 1st at UTC 0) utilizing a historical retrieving mechanism, calculating the accumulated NAV for each team using the TWR (Time-Weighted Return) measure, and then taking the arithmetic mean to derive an index benchmark that represents the market’s Funding Arbitrage.
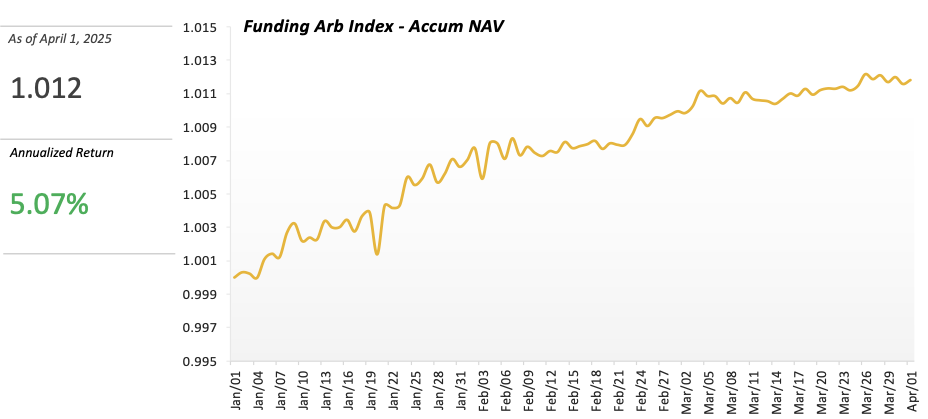
Note: We use the arithmetic mean instead of the weighted average because the current sample size is relatively small, and the weights in a weighted average cannot accurately reflect the actual weights of the trading team. Therefore, the impact of principal has been normalized.
Indicators
The cryptocurrency market saw a correction in Q1 2025 following Q4 2024's rally, as global policy uncertainty weighed on investor sentiment.
Given the relative stability of Funding Arbitrage, the Sharpe Ratio is not included in the scope of this study. Instead, we have selected 1-2 metrics from four perspectives—returns, risk, strategy characteristics and investment preferences—for market reference.
Profit and Loss (PNL) and Risk
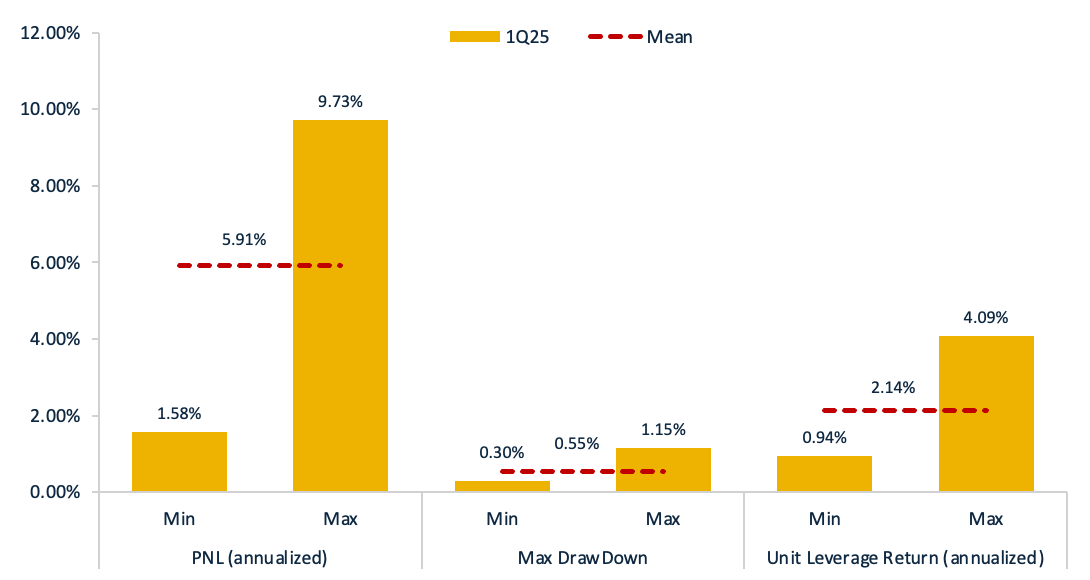
Note:
- PNL is calculated based on TWR; Max DrawDown and Unit Leverage Return are calculated based on daily data.
- Unit leverage return refers to the additional return generated by each increment of leverage when making an investment using leverage. We calculated unit leverage return using daily PNL / daily leverage / daily principal.
- We use gross exposure % as leverage, with the formula: Gross exposure % = Total Gross Exposure / Portfolio Net Asset; Total Gross Exposure = SUM(Gross Exposure by Underlying excluding stable and fiat coins)
Strategy Features
The perpetual contract funding rate management capability serves as a critical performance indicator for Funding Arbitrage strategies. In this report, we analyze 1Q 2025 execution records across all participating teams, decomposing strategy returns into discrete components including funding income, trading fees, interest paid, and trading P&L. A higher proportion of funding income relative to total returns reflects greater proficiency in funding rate management.
To further enhance the evaluation framework, we introduce a new standardized metric: Funding Yield per Gross Exposure (FYpGE). This KPI measures funding income generated per unit of gross exposure. Higher FYpGE values demonstrate specialized expertise in capturing funding fees.
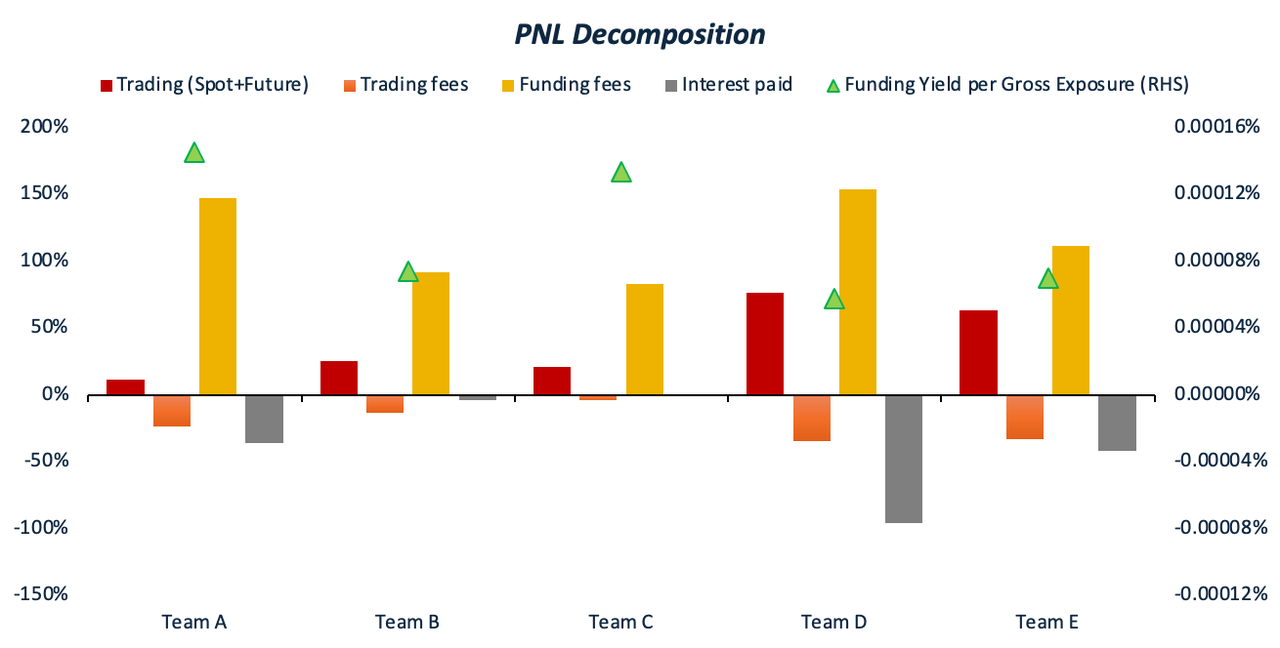
Note:
- The PNL Decomposition is calculated using various records to generate detailed PNL data, breaking down portfolio performance into individual components.
- Funding Yield per Gross Exposure (FYpGE) = Funding fees / Total Gross Exposure / Total trading days
- We use gross exposure instead of using NAV because of considering the value of contract
- Total Gross Exposure = SUM(Gross Exposure by Underlying excluding stable and fiat coins)
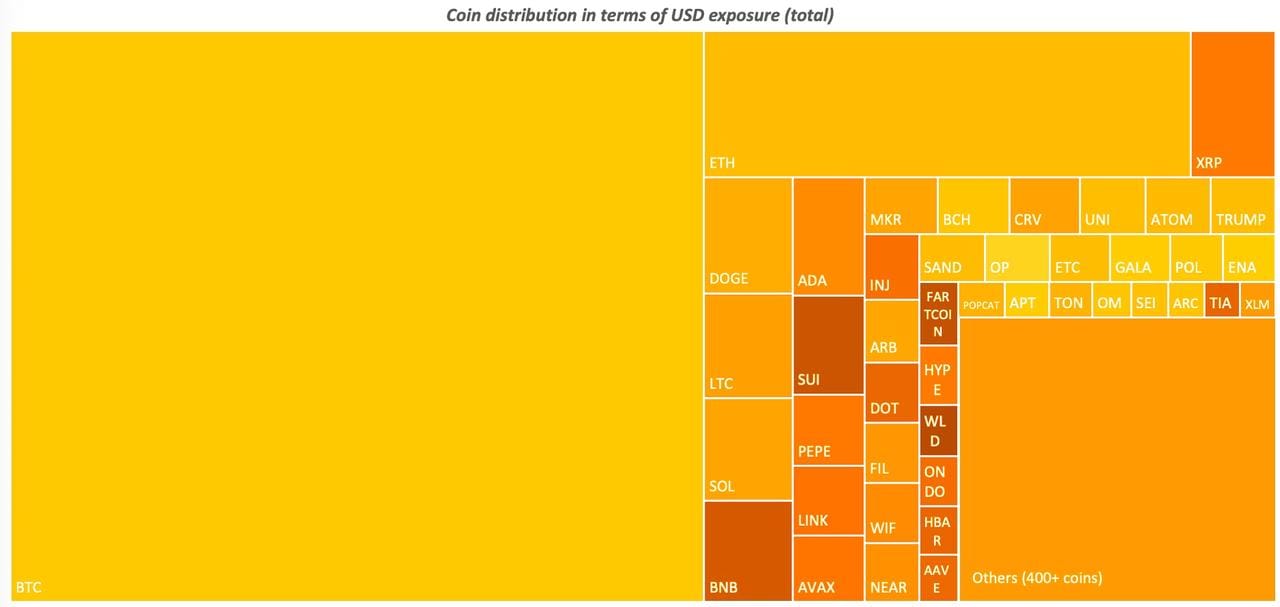
Coin Distributions
We have combined daily snapshot data from trading teams to summarize the asset positions from January 1st, 2025, at 00:00 UTC to April 1st, 2025, at 00:00 UTC, and aggregated the USD exposure for each underlying currency based on the underlying assets.
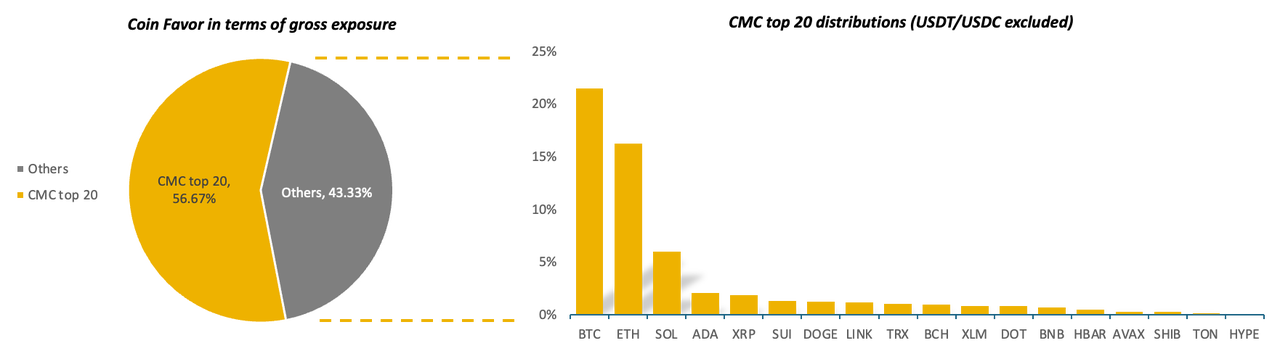
Note:
- USD exposure = Delta * Underlying Price
- We calculated the distribution ratio using each coin's gross exposure divided by total gross exposure.
- We summarized the data based on underlying currencies and normalized the impact of principal.
To assess the dispersion across coins, we defined the aggregation degree β (ranging from 0 to 1). When β is closer to 1, it indicates that the investment is more concentrated in a few coins, while when β is closer to 0, it indicates that the investment is more diversified.
Funding Arbitrage and Long Short Strategy are among the most prominent trading approaches in the cryptocurrency market. There are more indicators that can be analyzed and taken into consideration. In our future reports, we will also consider MMR/UniMMR, ADL, Loan rate, etc, to provide the market with well-rounded strategy research on a quarterly basis.
Additionally, the total AUM of the teams we collaborate with has exceeded $2.0 billion. In the future, we aim to increase the number of teams we monitor, along with the total AUM, which will also lead to a noticeable improvement in diversity.
Authored by Quinn Hu from 1Token, with data kindly provided by eleven trading teams.
Reference
Thanks to the following leading crypto trading teams for collaborating with 1Token on our first crypto strategy-related performance analysis:
-
4-Alpha
- Funding Arb
- 4Alpha Group (formerly known as “Huobi Asset Management”), founded in 2018, is a top private wealth management firm in the cryptocurrency sector in Asia with AUM over US$ 600m now.
- The Company has consistently delivered value to 60+ ultra high net worth clients over the last 6 years with proven track records.
- The Company now has a team of 40+ staff including quant traders, researchers, computer scientists, risk managers, and institutional sales. Its quant team comprises Ph.Ds. from prestigious institutions and/or former engineers from leading global tech giants and also seasoned OG developers from the cryptocurrency industry, building profound technological prowess.
-
Binquant
- Funding Arb and Long Short
- Founded in 2018, Binquant focuses on quantitative development and asset management in the digital asset market and is now one of the largest digital asset managers. The main strategies include market-neutral arbitrage, CTA, high frequency, and DeFi. Main clients include hedge funds, VC funds, large financial institutions, family offices, and exchanges for asset accretion.
-
BSSET
- Funding Arb
- BSSET (Binary Asset) is a leading digital asset management company specializing in high-frequency trading and market-neutral quantitative strategies across/in both centralized exchanges (CEX) and decentralized exchanges (DEX). Our experienced team is dedicated to delivering superior alpha to our clients consistently. Using advanced proprietary trading infrastructure and a custom research platform, Bsset identifies and exploits pricing inefficiencies across various instruments. Our main strategies include funding rate arbitrage, spread arbitrage, and high-frequency market making, which reduce execution costs and offer comprehensive risk management. We have a 7*24-hour risk control system that continuously monitors and manages potential risks in real-time.
-
Grandline
- Funding Arb and Long Short
- GrandLine Technologies is a systematic multi-strategy trading firm established in 2018. Grandline specializes in deploying mid-frequency market-neutral strategies across major digital assets on both centralized and decentralized exchanges. With decades of expertise in quantitative portfolio management , the team is recognized for its exceptional research and risk management process, earning accolades from esteemed institutions like Hedgeweek and HFM.
-
Hyperithm
- Long Short
- Founded in 2018, Hyperithm is a crypto hedge fund manager headquartered in Tokyo and Seoul, backed by world-renowned investors including Coinbase, Samsung, Kakao, and Hashed.
- Our asset management arm specializes in algorithm-based, market-neutral strategies tailored for institutions and high-net-worth individuals (HNWIs).
- Beyond asset management, Hyperithm actively supports the Web3 ecosystem as a dedicated evangelist. Through our venture arm, we invest in Layer 1 & 2 protocols, decentralized applications (dApps), Web3 gaming projects, and next-generation asset managers that are shaping the future of blockchain.
-
JZL
- Funding Arb
- JZL Capital, specializing in Spot-Perpetual Arbitrage, is a top-tier quantitative team in Asia providing stable return performance and achieving over $200 million in AUM. The core team comprises members passionate about academic research and actively expanding its global client base by providing unparalleled quantitative trading solutions.
-
KFQuant
- Long Short
- Founded in 2017, KFQuant is a top low-latency trading systems provider from traditional finance, powering a significant share of multi-billion-dollar hedge funds and proprietary trading desks. Specializing in ultra-fast systems and cross-sectional multi-factor strategies—hallmarks of traditional finance. We integrate tick-by-tick data, alternative alpha signals, streaming-learning models, and automated portfolio optimization into a seamless research-to-execution pipeline. Our market-neutral derivatives long-short strategies deliver high capacity and Sharpe ratios, combining institutional-grade infrastructure with cutting-edge quantitative frameworks to sustain uncorrelated returns across cycles.
-
Lepton
- Funding Arb
- Founded in 2021 by seasoned quant traders with 10+ years of arbitrage expertise in traditional finance, we specializes in systematic crypto arbitrage strategies. Our proprietary low latency execution system enables algorithmic capture of funding rate arbitrage, basis arbitrage, and market making opportunities within CEX venues. Through adaptive risk frameworks and dynamic exposure management, we maintain rigorous operational discipline to proactively mitigate tail risks while exploiting transient market inefficiencies.
-
ML Tech
- Funding Arb and Long Short
- ML Tech is a Digital Assets Platform that provides optimized blended portfolios and bespoke products tailored to meet all investment objectives and risk appetites. Investors gain access to a curated array of delta neutral, market neutral and beta trading strategies via the ML Tech “Marketplace”. Real time NAV and portfolio insights are available in the ML Tech “Dashboard”. Through its offerings, ML Tech provides comprehensive solutions that bridge the gap between institutional investors and unique alpha opportunities only available in digital asset markets. The ML Tech team brings decades of proven experience in HFT and quantitative trading, successfully creating and deploying digital asset trading strategies with optimized execution and exchange connectivity.
-
Pythagoras
- Funding Arb and Long Short
- Established in 2014, Pythagoras manages a suite of crypto funds based on quantitative modeling. As one of the longest-running crypto hedge funds, it is known for delivering outstanding returns in both bearish and bullish market cycles. Using systematic, non-discretionary, and automated trading strategies, Pythagoras specializes in market-neutral and dollar-neutral strategies to consistently outperform the crypto market.
-
Trade Terminal
- Long Short
- Trade Terminal (TT), a crypto quantitative hedge fund, delivers high Sharpe quantitative strategies, market-making services, early-stage funding, and consulting. Named Binance's TOP 2024 Liquidity Provider of the Year, TT operates globally across spot and derivatives markets, leveraging advanced technology and strong risk management to optimize performance.
Collaboration teams for this study primarily come from Asia. In the future, we hope to expand the diversity of our sample to include teams across various regions around the world. If you'd like to be part of our benchmark study, please feel free to contact our partnership manager at joey.shi@1tokentech.com.
About 1Token
1Token(https://1token.tech/) is a SOC2 Compliant software for institutional Crypto Portfolio, Risk, Operations, Accounting and Lending Management, named Hedgeweek's 2024 "Portfolio Management Solution of the Year", serving 60+ top-tier institutional clients in the crypto industry, including SMA Allocators, Multi-Strategies Trading Funds, DMA Prime Brokers, Asset Managers, Lending Institutions, Fund Admins & Auditors across the US, EU, and APAC, collectively managing over $20 billion in assets.
For general inquiries like authorization requests of the report, product demo, or general collaboration opportunities, please email service@1token.trade.
Disclaimer
The information contained in this report is provided by 1Token for general informational purposes only and does not constitute professional advice. While every effort has been made to ensure the accuracy of the information, no warranty or representation, express or implied, is made regarding its completeness or reliability. The contents of this report reflect the views and opinions of the author(s) as of the date of publication, and may be subject to change without notice.
The reader should independently verify any information or conclusions presented herein before making decisions based on the report. 1Token and any affiliated parties are not responsible for any actions taken or not taken as a result of reading this report.
This report may contain forward-looking statements, estimates, and projections based on current expectations. These statements are subject to risks and uncertainties that could cause actual results to differ materially from those anticipated. 1Token assumes no obligation to update or revise any forward-looking statements.


Comments ()