Portfolio simulation for digital asset FoF and MoM

TL;DR
FoF (Fund of Funds) and MoM (Manager of Managers / Multi-Manager funds) allocate capital across multiple underlying funds or managers, where in digital asset markets, MoM is preferred due to higher transparency and lower counterparty risk.
Success depends on optimal allocation, evaluation and rebalancing, guided by key performance metrics:
- PnL % / Drawdown
- Sharpe ratio / Calmar ratio
High-frequency data (hourly/daily) enables:
- Simulation of different portfolio combinations
- Backtesting for performance optimization
In the future, AI and NLP technologies can further streamline portfolio construction by:
- Allowing users to generate strategies via natural language (e.g., “Show me high Sharpe, low drawdown portfolios”)
This article covers:
- The role of performance data analytics in FoF/MoM
- Critical performance metrics
- The future of AI-driven portfolio construction
Takeaway: MoM transparency helps, but allocators still need PMS tooling to consolidate CeFi/DeFi data, verify performance, and simulate allocations before rebalancing.
What do FoF and MoM do
Fund of Funds (FoF) and Manager of Managers (MoM) means investment managers don’t run trading strategies by themselves. While FoF typically invests directly in other investment funds, MoM structures allocate account with capital to external managers who then deploy the strategy into the assigned trading accounts, both creating a portfolio by allocation among underlying funds or managers in an optimal way to gain alpha from the market. While such investment managers are either purely FoF or purely MoM, there are some hybrid players combining both investment styles into funds and managers.
Typically, a FoF or a MoM would manage ten to a hundred underlying funds or managers, uncorrelated to the market and uncorrelated to each other. FoF and MoM strategies have emerged as sophisticated approaches for achieving diversification and risk-adjusted returns, by cherry picking the best of the best strategies. While the cost is that there’s another layer of fund fees on top of the underlying funds’ and managers’ fees.
The challenge lies not just in selecting high-performing managers or funds, but in optimally allocating capital among them—a continuous task. The performance of a FoF or MoM portfolio depends not only on the individual performance of its components, but also on their correlation, volatility, and drawdown behavior. And as digital asset market trading infrastructure become more data-rich and transparent, the need for real-time, data-driven decision-making is essential.
What’s special in digital asset market
We will skip those obvious things like 24/7 trading, higher leverage, fast deposit withdrawals, or even free market data and API connectivity… Just focus on what’s relevant with FoF / MoM based on 1Token’s observations.
- The number of MoM is much higher than the number of FoF. There are mainly 2 factors that make MoM structure much more adopted
- Higher transparency: the accounts belong to the allocator, so the allocator can know real-time performance with proper infra, and even force halt the trading when there’s unexpected trading behavior.
- Lower counterparty risk: digital asset is by nature decentralized, so even with developments from custody infrastructure, the confidence of counterparty is still way lower than centralized traditional financial market.
- Coin denomination / class: in digital asset market, thanks for the high liquidity of coins, and exchange’s unified collateral calculations, it’s common to manager coin denominated portfolios, or in fund terms ‘BTC class’ or ‘ETH class’ besides USD class.
- Alpha not Beta. For FoF and MoM, Alpha strategies are way more popular than beta or smart beta strategies. Could be because most coins follow BTC price, and very few of them can beat BTC, which makes beta or smart beta strategies not popular with FoF or MoM. In the digital asset market, there are mainly 3 types of alpha strategies,
- Delta neutral arbitrage (funding, cross venue)
- Market neutral (long short, pair trading)
- Directional strategies.
Considerations for allocation
Portfolio managers of FoF and MoM optimize portfolios in different theories.
First of all, the PM needs to strategically define the investment target, and decide which types they allocate and by how much. If the target is to have a stable net return that’s just better than T-bill and almost 0 drawdown, they should allocate mainly into arbitrage. While if the target is to have around 30% net return and tolerate drawdown of 10%, they should allocate mainly into directional strategies.
Then tactically, to achieve the best mix of strategies, the PM should aim (at least) below main metrics:
- PnL % (Profit and Loss Percentage): Measures the return relative to the capital invested. Higher PnL is desirable but must be contextualized with risk.
- Drawdown: Represents the peak-to-trough decline in portfolio value. Lower drawdown indicates better capital preservation.
- Sharpe Ratio: A risk-adjusted return metric that considers both returns and volatility. Higher Sharpe ratios imply more efficient returns per unit of risk.
- Calmar Ratio: Similar to the Sharpe ratio but uses maximum drawdown instead of volatility, making it particularly useful for capital preservation-focused strategies.
Back tracing and back testing
In portfolio management, historical performance and qualitative analysis played a dominant role in decision-making. Similarly, for FoF and MoM structures, though they don’t trade by themselves, quantitative data analysis is still crucial to deliver consistent alpha and outstand from peers. Here’s why:
- High-dimensionality: FoF and MoM portfolios may include ten to a hundred underlying funds or managers. The number of possible combinations grows exponentially, making intuitive judgment insufficient.
- Risk Management: Understanding drawdowns, volatility, and correlations between managers is essential to prevent systemic exposure and optimize diversification.
- Performance Attribution: Data allows precise decomposition of returns, enabling managers to identify which strategies, sectors, or managers are driving performance.
- Dynamic Rebalancing: As market conditions change, static allocations can become suboptimal. Timely adjustments to allocations based on data analysis can improve performance.
For PM from FoF and MoM, let’s take a break and ask yourself, how many times have you run into below questions:
- A trading team shared a daily spreadsheet, but is that real?
- If I believe it’s real, how does that performance compare to my existing portfolio?
- If overall it looks attractive, how much should I allocate into this strategy and what is my expected improvement to my overall portfolio in terms of performance and risk metrics?
- Where do I exit capital for this new strategy? Do I quit from a low performing one recently, or a more correlated one?
Back tracing is to verify trading team’s performance with API key. The API key directly returns the results from the exchanges, so the trading team cannot alter the records and results, though the trading team will cherry pick the best account. This would be another big topic.
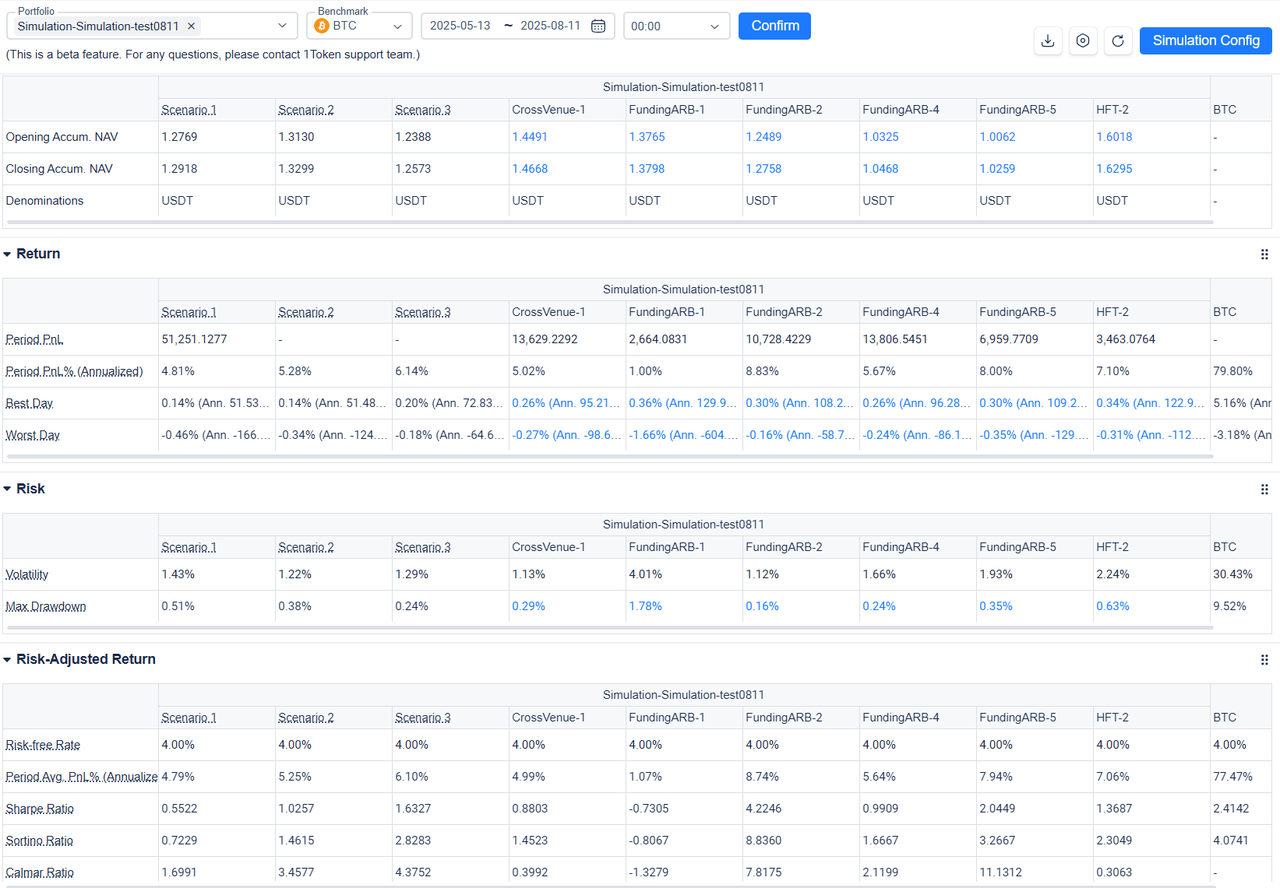
While back testing for FoF / MoM PM is to simulate different allocations and see the effects. Having access to hourly or daily performance data provides a significant edge in portfolio construction and optimization. Fine-grained data can simulate how different portfolio allocations would have been performed in the past period of time / style of market.
A case of back testing
Below are the real performances of several quant trading teams in Q2 2025 with a variety of arbitrage, long short and directional.
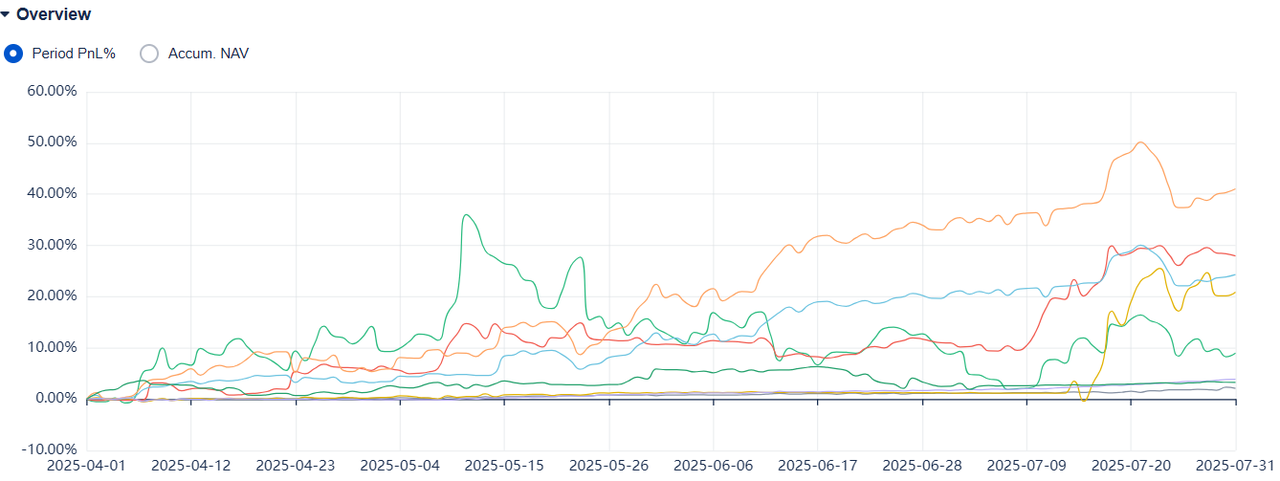
We can try 3 scenarios
- Aggressive - Only allocate into long short and directional, and 0 into arbitrage
- Hybrid - Allocate more into long short and directional, and less into arbitrage
- Conservative - Evenly allocate into all strategy
Here's the results (4.5% set as risk free rate)
Aggressive | Hybrid | Conservative | |
Annualized PnL % | 58.47% | 51.08% | 46.29% |
Max Drawdown | 5.28% | 4.46% | 3.95% |
Sharpe Ratio | 2.61 | 3.26 | 3.44 |
Calmar Ratio | 11.74 | 16.91 | 19.13 |
MoM PM can use above backtest to decide how to allocate, for best PnL %, or best Sharpe Ratio, or a combination of both?
The future: rise of artificial intelligence in portfolio construction
Imagine a future where a portfolio manager of FoF or MoM, or even a retail investor, can type:
“Give me 3 portfolio combination recommendations with Sharpe ratio above 1.5, annualized PnL % above 15%, and drawdown under 10%.”,Or “I want to have the highest PnL % when monthly drawdown should not exceed 4% and daily drawdown should not exceed 8%.”
Thanks to Natural Language Processing (NLP) and Large Language Models (LLMs), such capabilities are no longer science fiction. These systems can parse user intent, translate it into quantitative parameters, access real-time or historical data, and run optimizations in the background to return actionable results.
So potential use cases in digital asset FoF and MoM
- Conversational Portfolio Construction: Users describe their investment goals in natural language; the system builds and recommends portfolios.
- Automated Reporting: AI can generate performance commentary, attribution analysis, and risk reports using plain English.
- Manager Selection: AI can aggregate performance, sentiment, and risk data to recommend or rank fund managers.
- Rebalancing Alerts: AI systems can notify managers when a portfolio drifts from its optimal configuration or when performance thresholds are breached.
What does 1Token do
In the high-stakes world of Fund of Funds and Manager of Managers, optimal allocation is both an art and a science. 1Token leverages high quality historical data, performance metrics, and simulation tools to enable enhances the way FoF and MoM manage and optimize the portfolio, with more informed and dynamic decision-making.
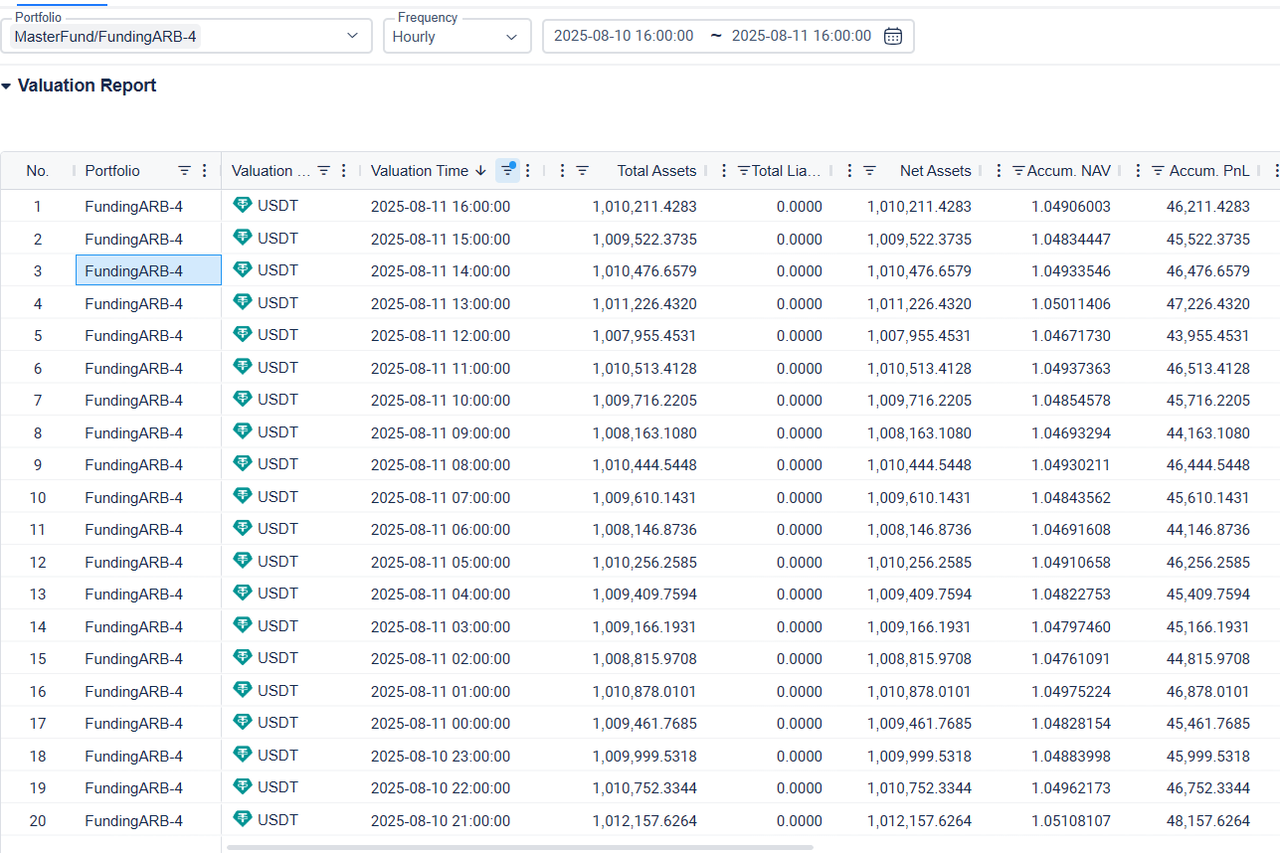
Real-time and hourly performance data
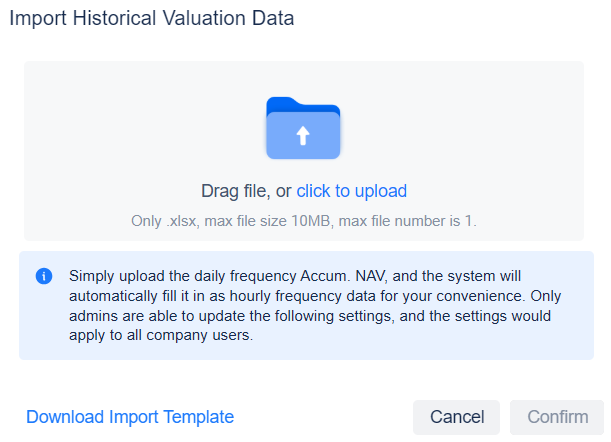
Import external daily and hourly performance data
Set the hypothetical ratios
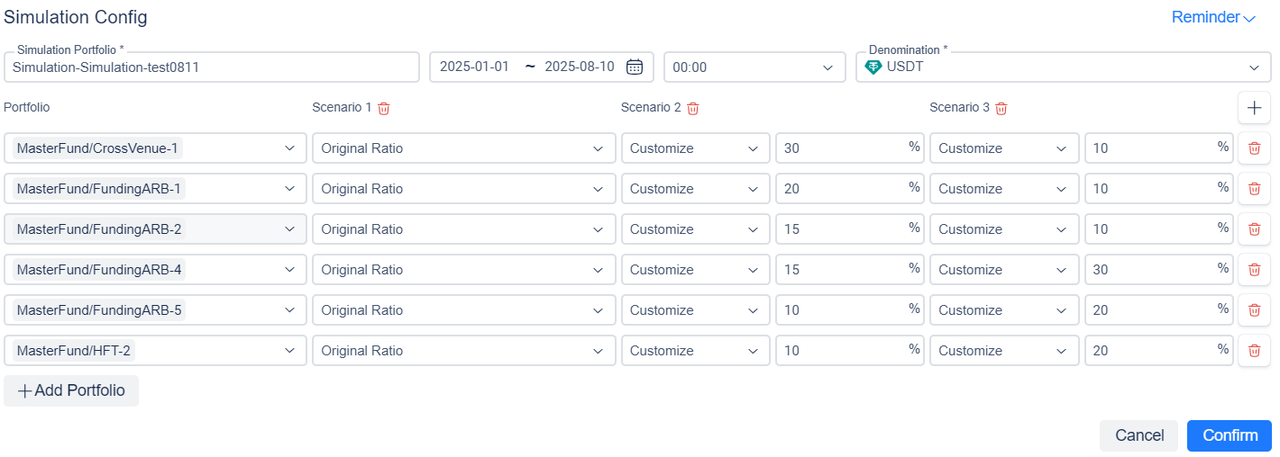
Generate simulated hourly performance results
While the integration of AI and data analytics promises transformative benefits of efficiency and effectiveness, there are important considerations:
- Data Quality: All decisions should be based on accurate and real data. Inaccurate or delayed data can lead to poor decisions.
- Overfitting Risks: Especially with machine learning, there’s a risk of tailoring models too closely to past data, reducing generalizability.
- Interpretability: Black-box models can be difficult to explain to stakeholders. If the results differ from obvious logic, which result should we take?
—In the future, just like on DeFi there’s AgentFi recently, FoF and MoM manager should also be equipped with 1Token to access sufficient data and artificial intelligence to outperform from the market.


Comments ()