
Crypto Quant Strategy Index XIV June & July 2026
Executive Summary
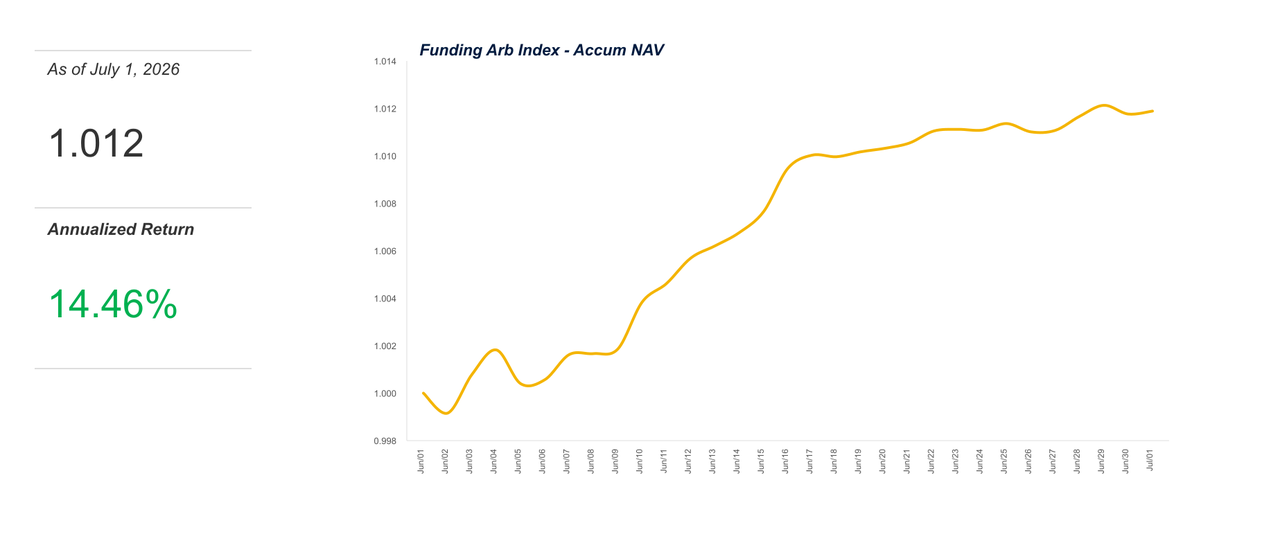
This report presents an index benchmark analysis developed by 1Token in collaboration with crypto trading teams. Covering June and July 2026, it evaluates Funding Arbitrage, Long Short and Directional strategies across returns, risk, strategy characteristics and asset concentration, providing a reference for the market. In July, the Long Short index gained 5.76%, reversing a 7.78% decline in June, while the Directional index fell 3.74% after a 2.54% gain in June. Funding Arbitrage remained positive, returning 0.71% in July versus 1.19% in June.
Parameters
- Quote source: CoinMarketCap (CMC)
- Granularity: Daily
- Index start time:June 1 and July 1, 2026, respectively, at 00:00 UTC
- Cut-off-time: 0:00 UTC+0
- Sample Exchange Distribution: Binance, OKX, Bybit, Gate, LTP Rapidx
- Accum. NAV calculation method: TWR (Time-Weighted Return)
- Risk-free rate: 4.3% (based on avg data of US 10-Y Treasury Yield in 2025)
- Daily Minimum Acceptable Return (MAR): 0
Note: Exchange selection may affect reported performance because fee structures, commissions, execution conditions, and slippage differ across venues. The index does not adjust for these venue-specific differences, which should therefore be considered when comparing results.
Calculation method
We have retrieved the assets of multiple crypto trading teams to the same starting point (May 1st at UTC 0) utilizing a historical retrieving mechanism, calculating the accumulated NAV for each team using the TWR (Time-Weighted Return) measure, and then taking the arithmetic mean to derive an index benchmark that represents the market’s Funding Arbitrage.
2026-06 | funding arb index
2026-07 | funding arb index
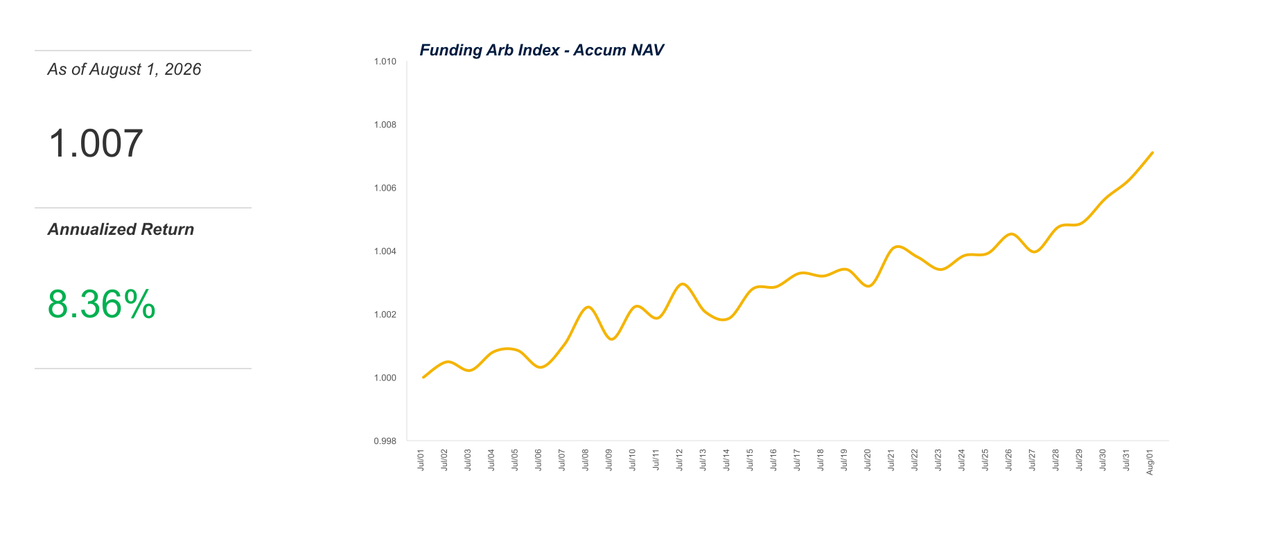
Note: We use the arithmetic mean instead of the weighted average because the current sample size is relatively small, and the weights in a weighted average cannot accurately reflect the actual weights of the trading team. Therefore, the impact of principal has been normalized.
Indicators
Profit and Loss (PNL) and Risk
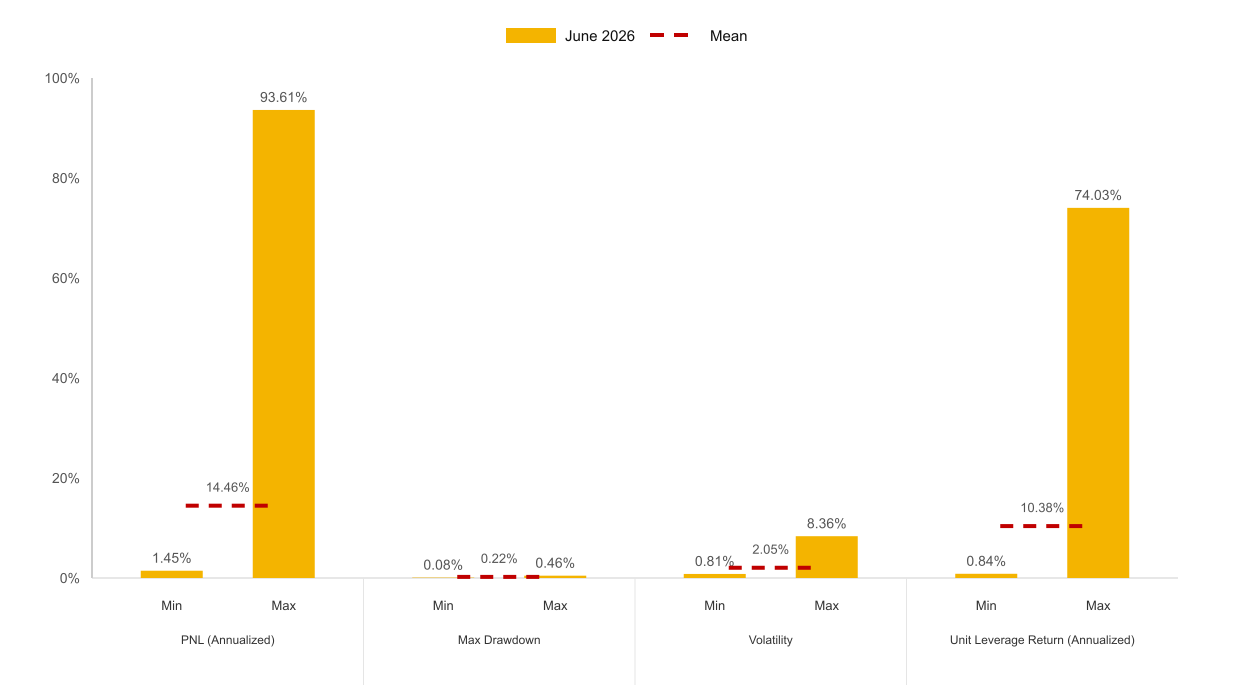
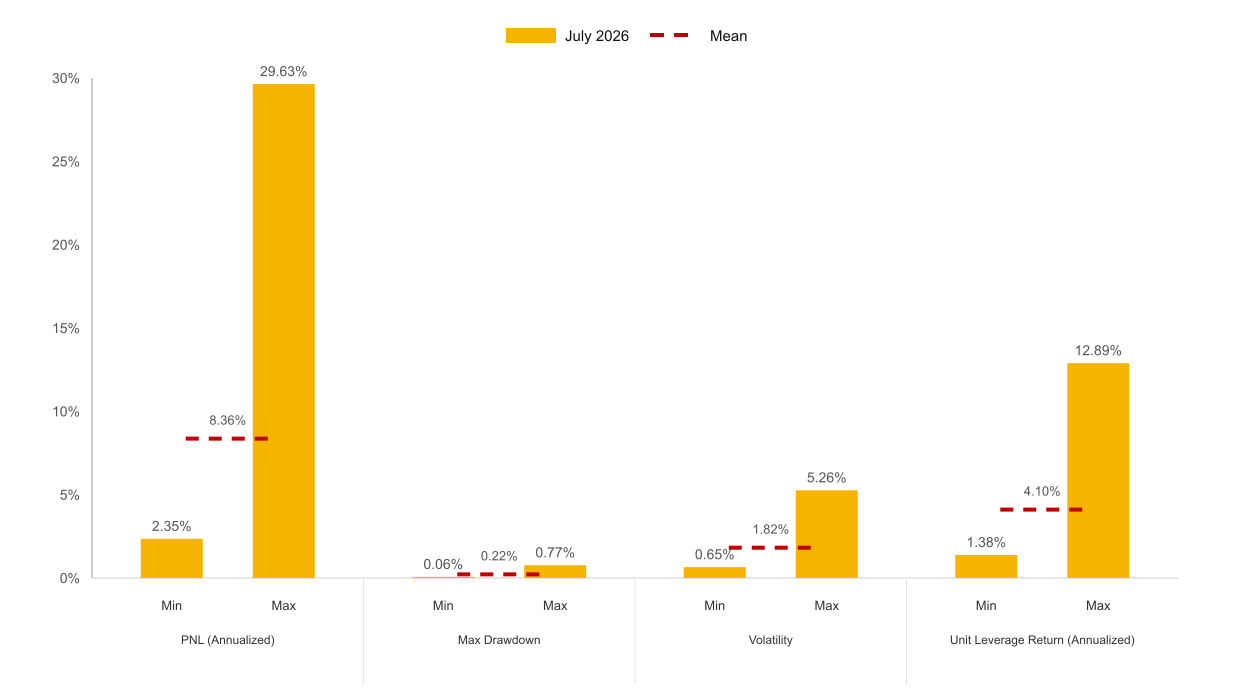
Funding Arbitrage’s mean annualized return eased from 14.46% in June to 8.36% in July, while mean maximum drawdown remained near 0.22% in both months.
2026-06 | PNL and risk | funding arb
2026-07 | PNL and risk | funding arb
Note: See Index Formula for full methodology and calculations.
Strategy Features
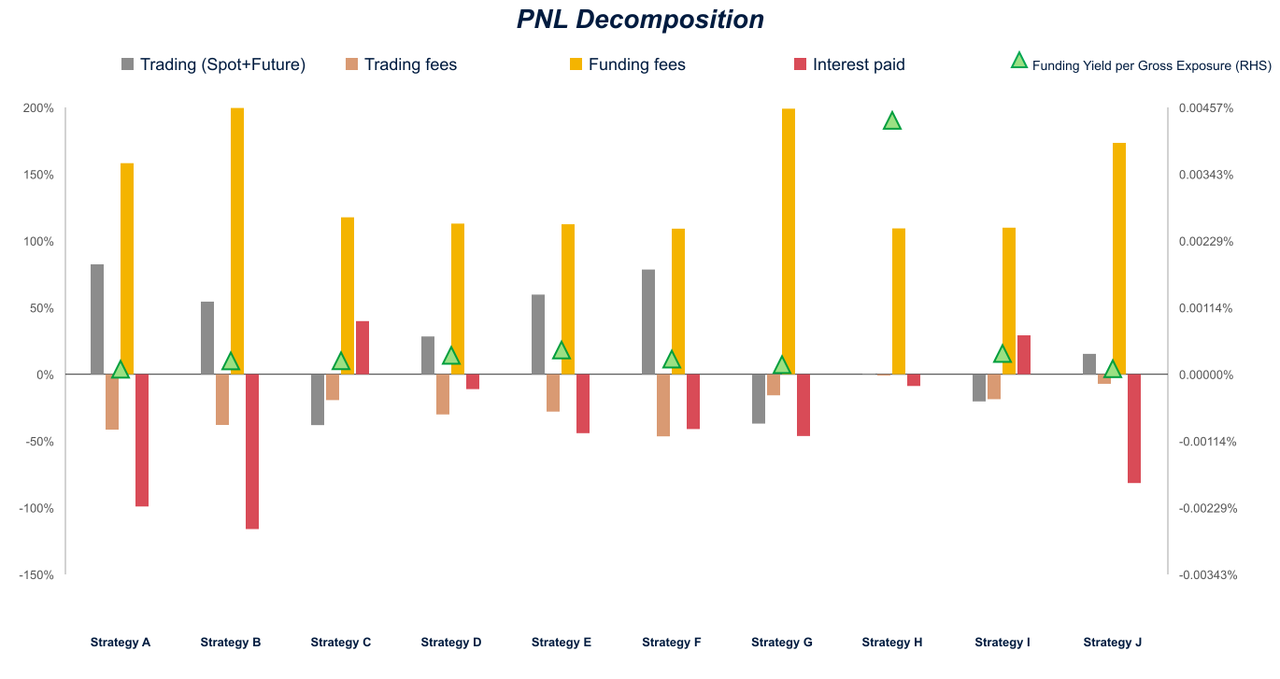
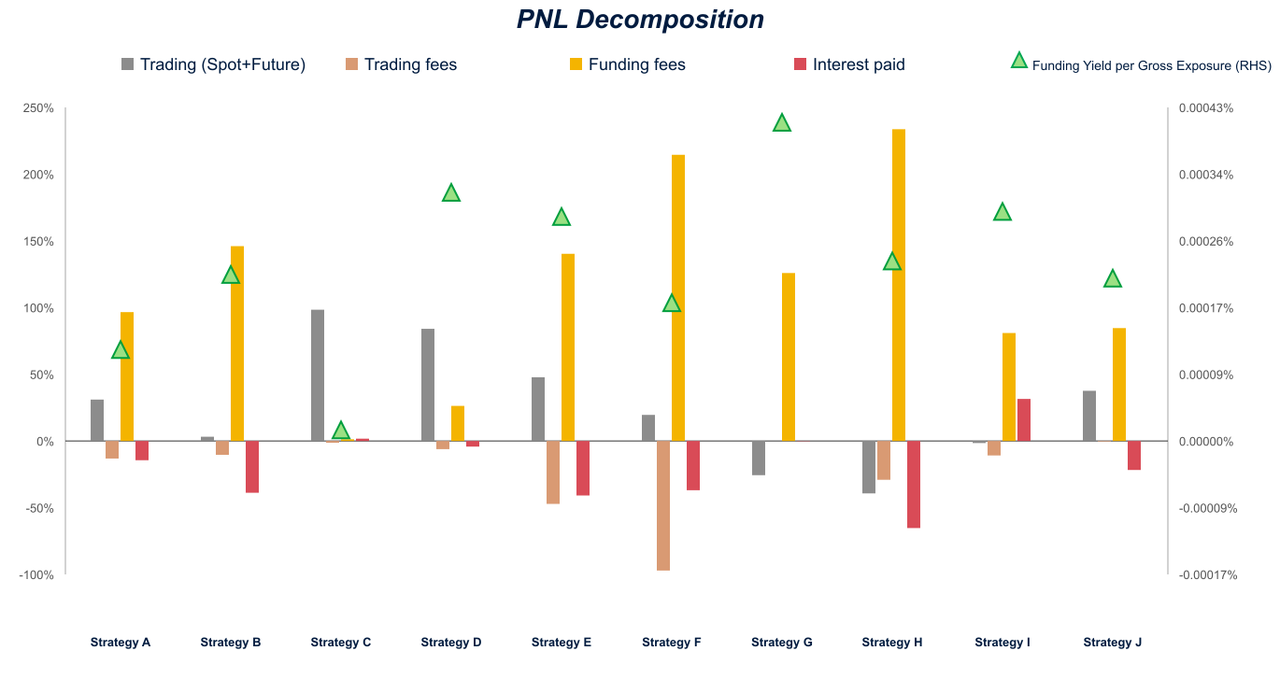
The perpetual contract funding rate management capability serves as a critical performance indicator for Funding Arbitrage strategies. In this report, we analyze June andJult 2026 execution records across all participating teams, decomposing strategy returns into discrete components including funding income, trading fees, interest paid, and trading P&L. A higher proportion of funding income relative to total returns reflects greater proficiency in funding rate management.
To further enhance the evaluation framework, we introduce a new standardized metric: Funding Yield per Gross Exposure (FYpGE). This KPI measures funding income generated per unit of gross exposure. Higher FYpGE values demonstrate specialized expertise in capturing funding fees.
2026-06 | PNL decomposition | funding arb
2026-07 | PNL decomposition | funding arb
Note:
- The PNL Decomposition is calculated using various records to generate detailed PNL data, breaking down portfolio performance into individual components.
-
See
Index Formula
for full methodology and calculations.
Coin Distributions
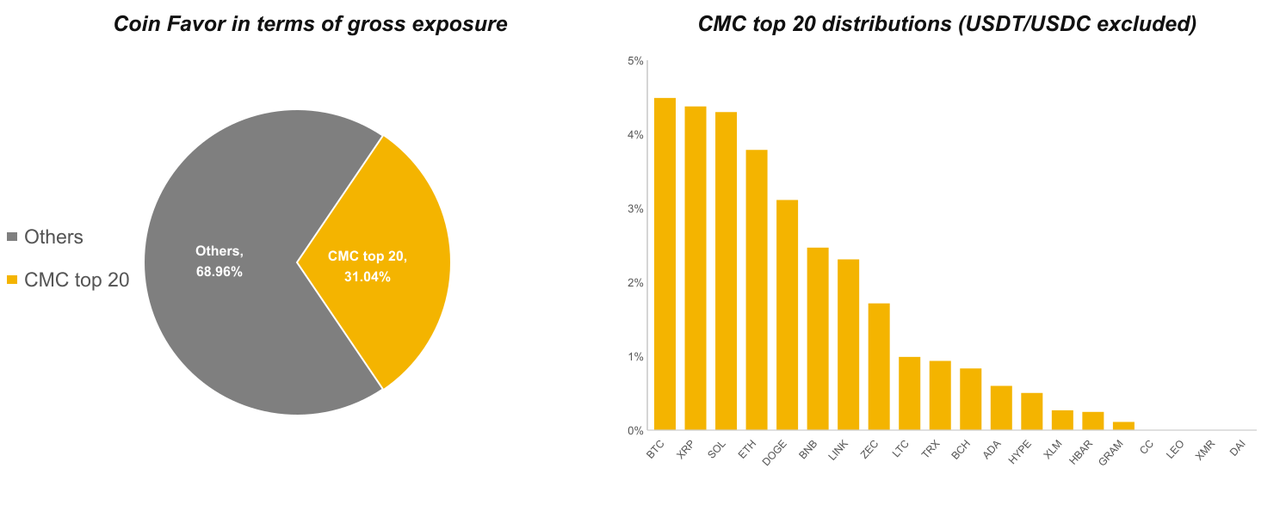
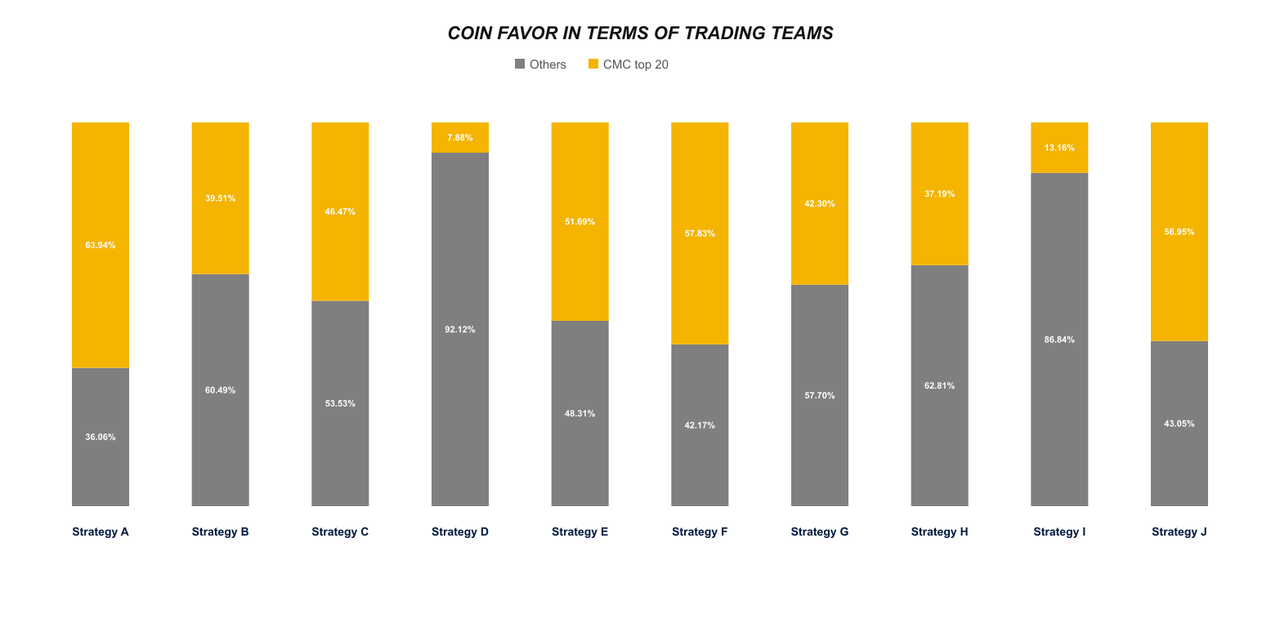
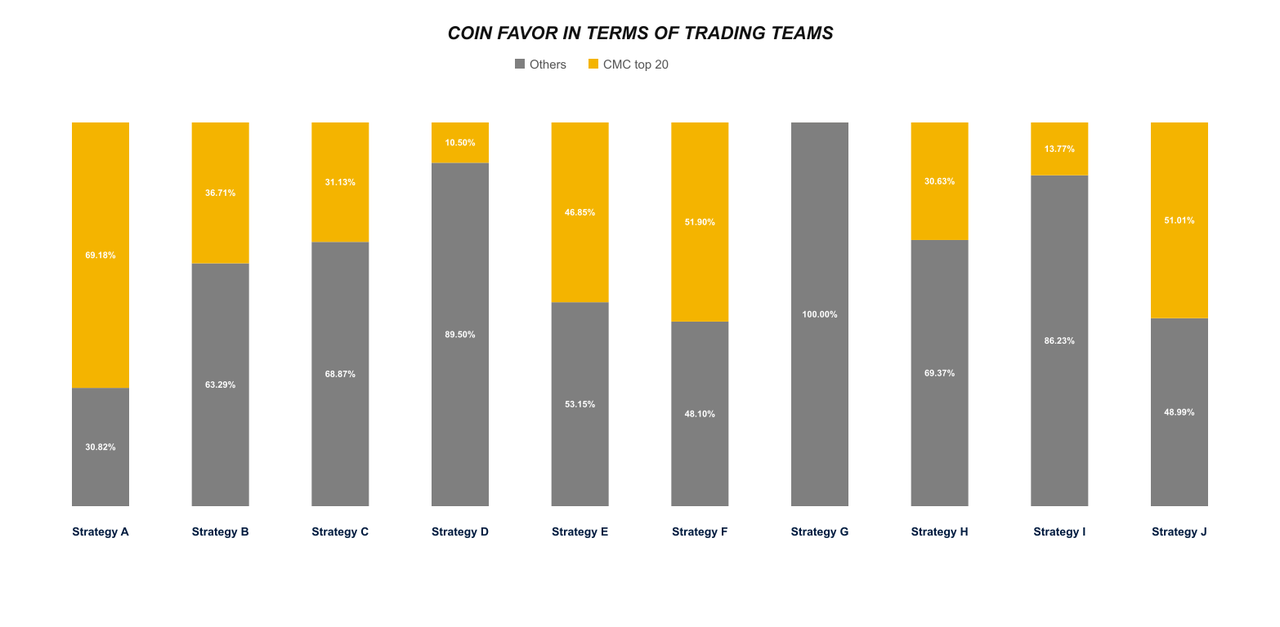
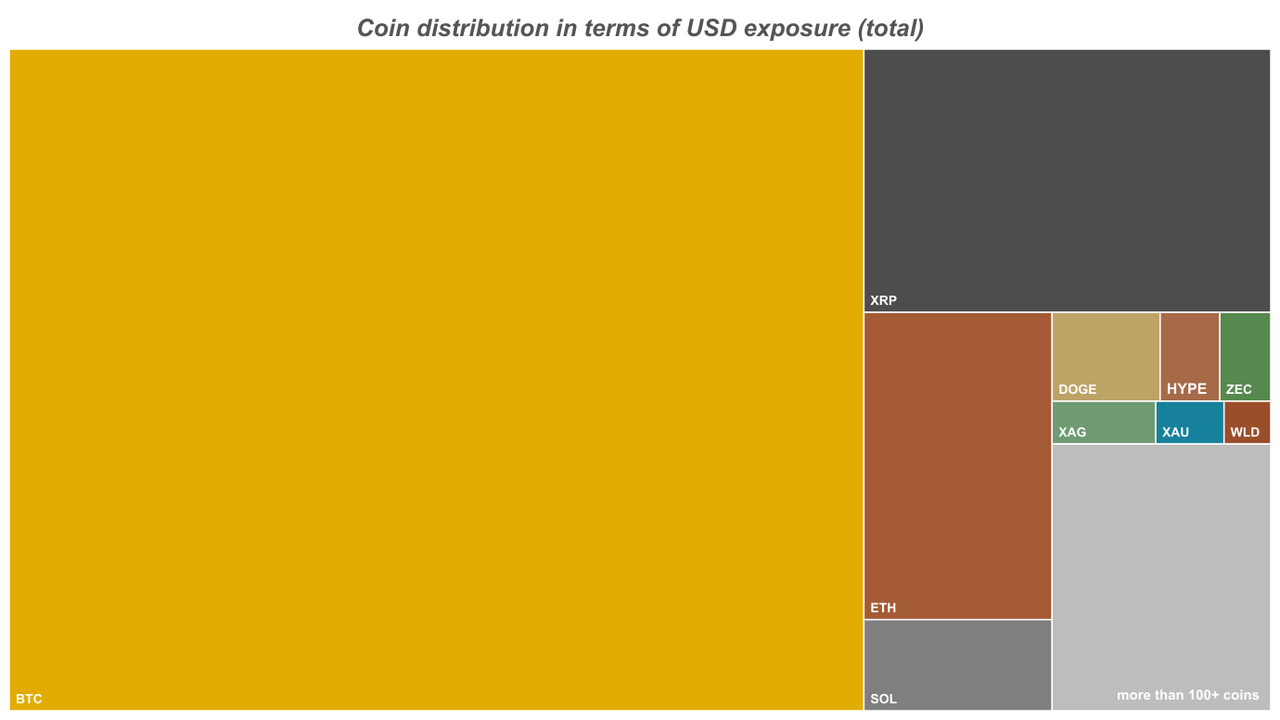
We have combined daily snapshot data from trading teams to summarize the asset positions from June 1st, 2026, at 00:00 UTC to August 1st, 2026, and aggregated the USD exposure for each underlying currency based on the underlying assets.
2026-06 | Coin distribution | funding arb
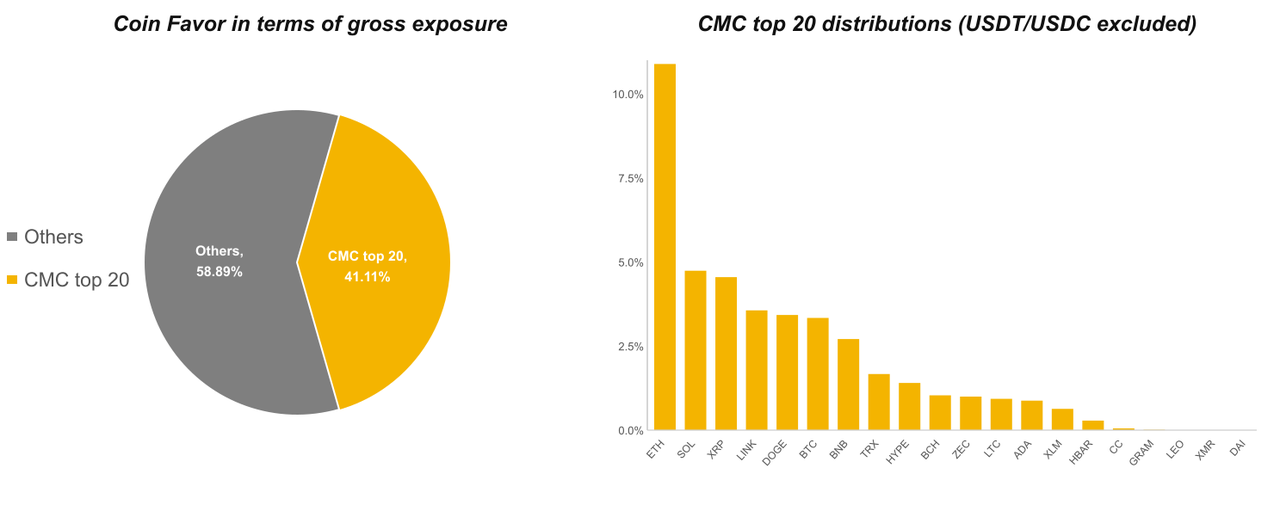
2026-07 | Coin distribution | funding arb
2026-06 | Coin favor by team | funding arb
2026-07 | Coin favor by team | funding arb
2026-06 | CMC top-20 exposure by team | funding arb
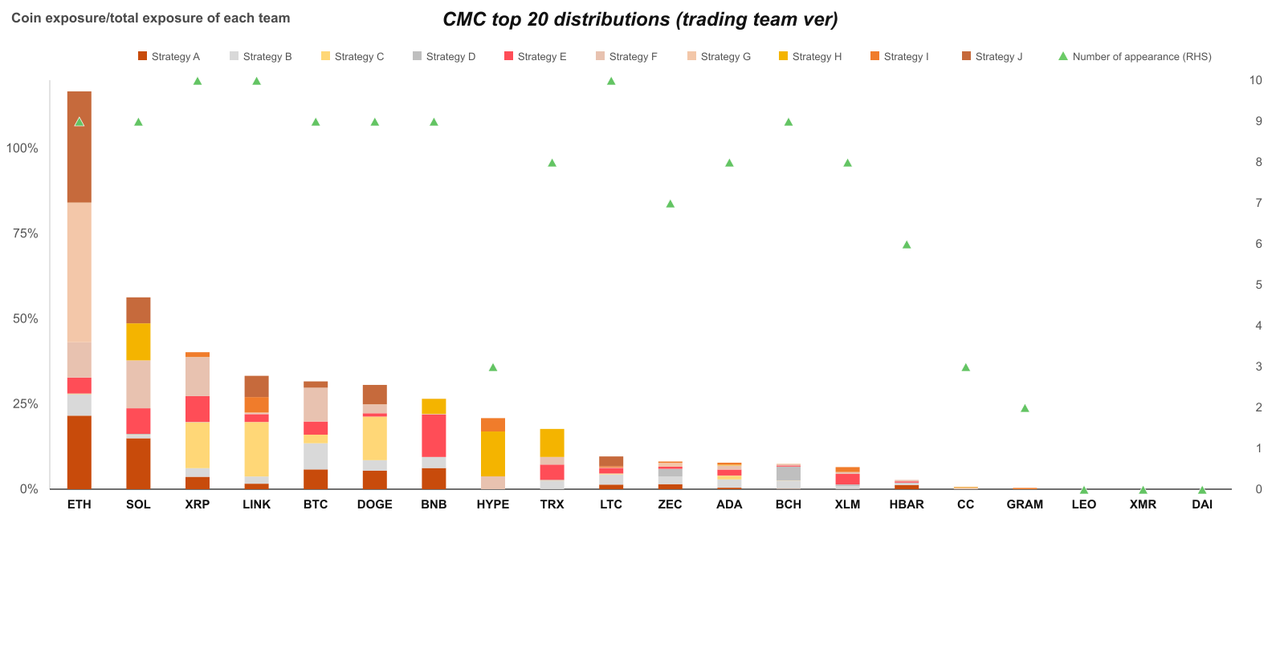
2026-07 | CMC top-20 exposure by team | funding arb
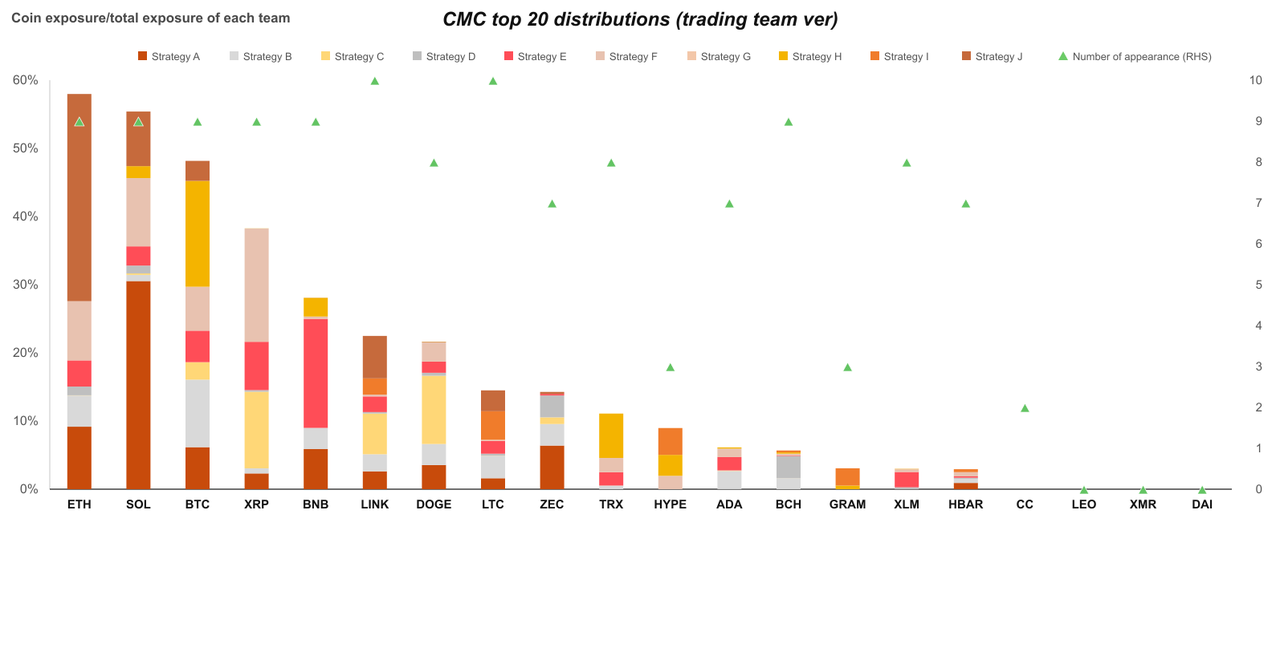
Note:
- USD exposure = Delta * Underlying Price
- See Index Formula for full methodology and calculations.
To assess the dispersion across coins, we defined the aggregation degree β (ranging from 0 to 1). When β is closer to 1, it indicates that the investment is more concentrated in a few coins, while when β is closer to 0, it indicates that the investment is more diversified.
2026-06 | Coin exposure treemap | funding arb
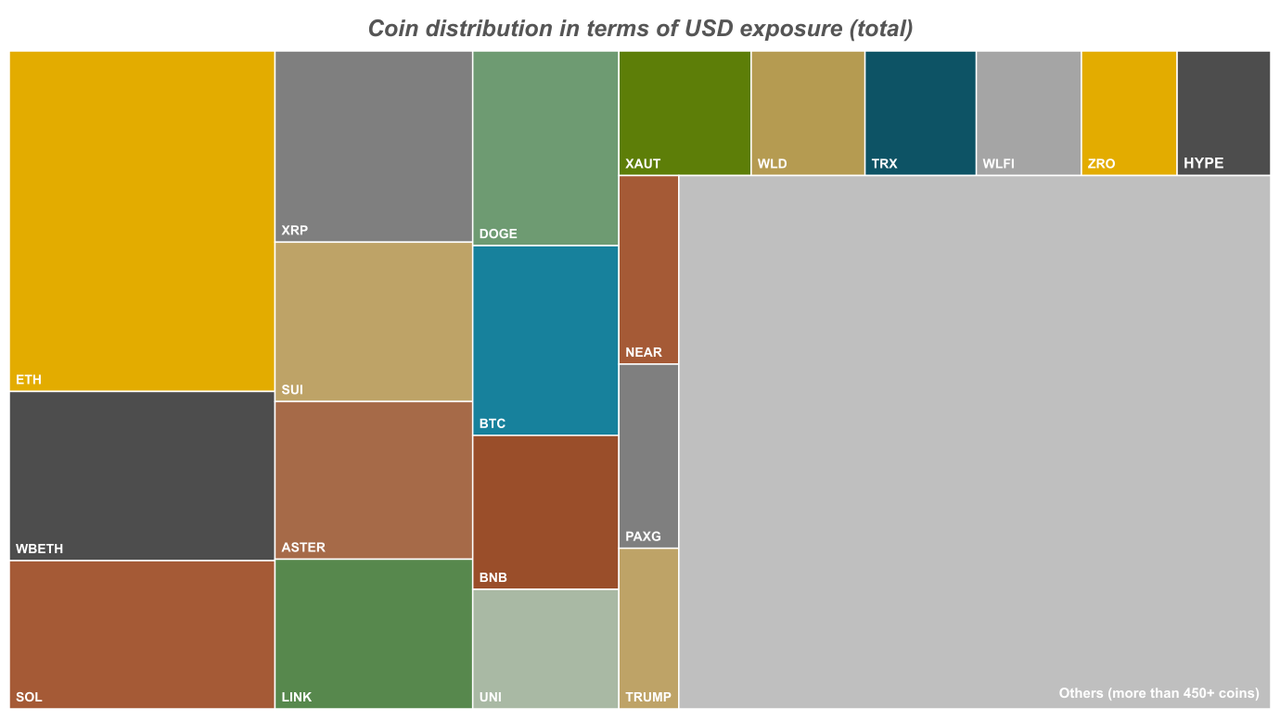
2026-07 | Coin exposure treemap | funding arb
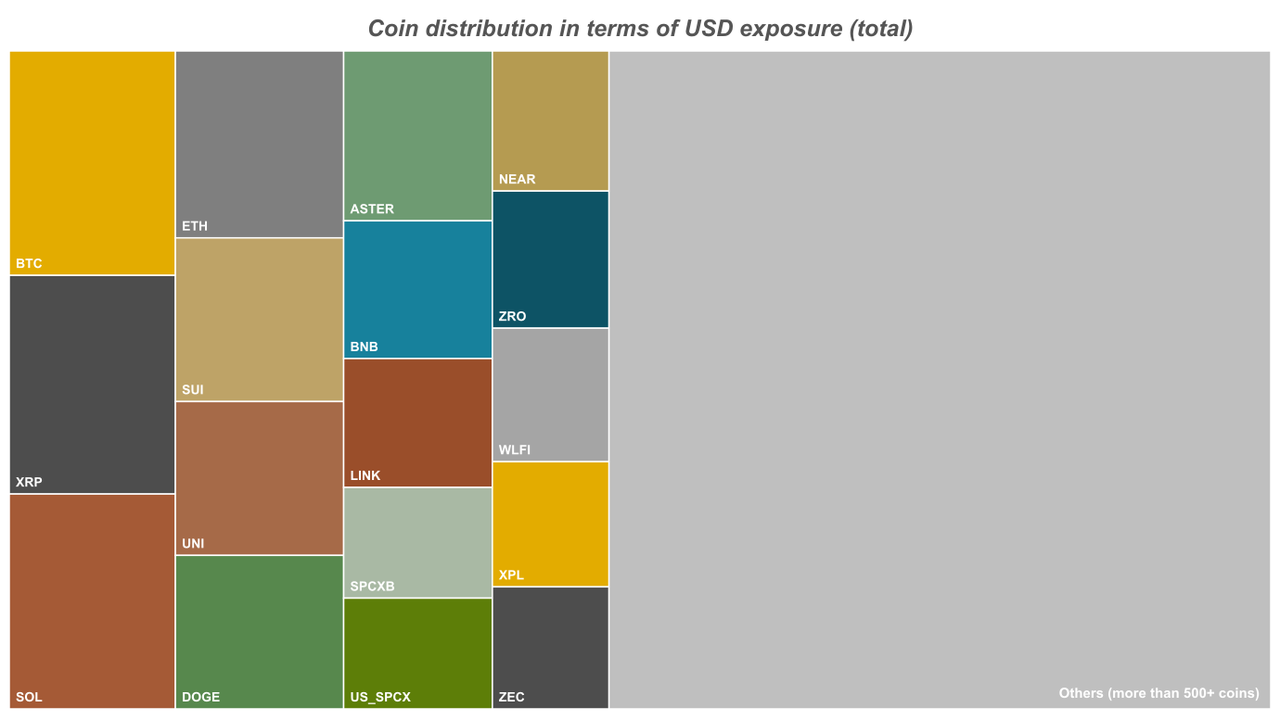
Calculation method
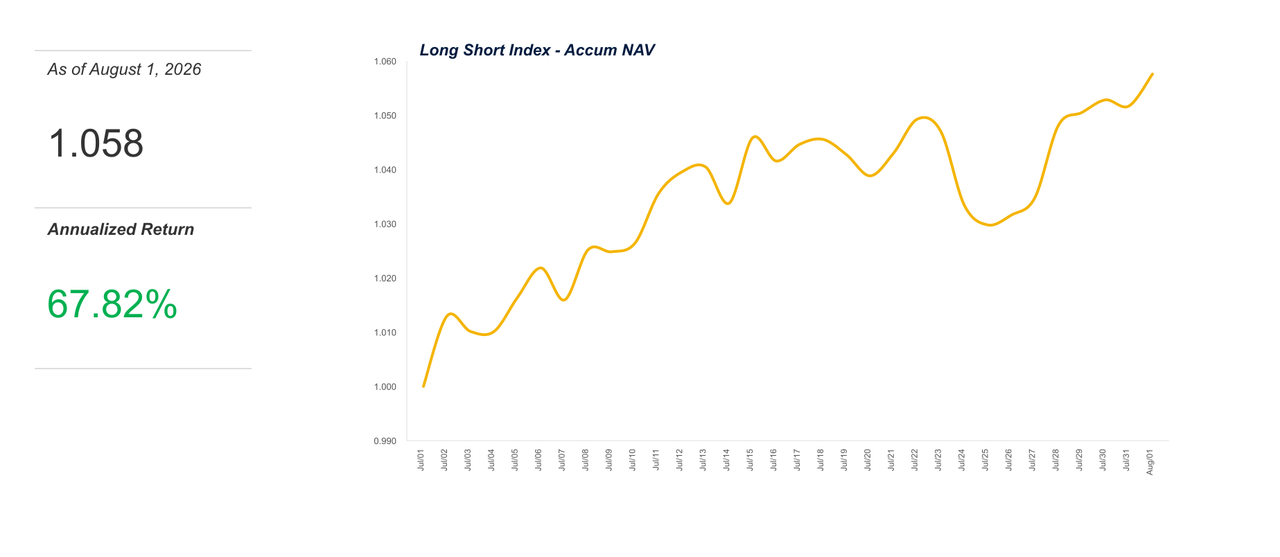
For each reporting month, we rebased each participating team’s portfolio to an initial NAV of 1.000 at 00:00 UTC on the first day of the month. We then calculated each team’s accumulated NAV using the Time-Weighted Return (TWR) method and took the arithmetic mean to construct a market benchmark for Long Short strategy.
2026-06 | long short index
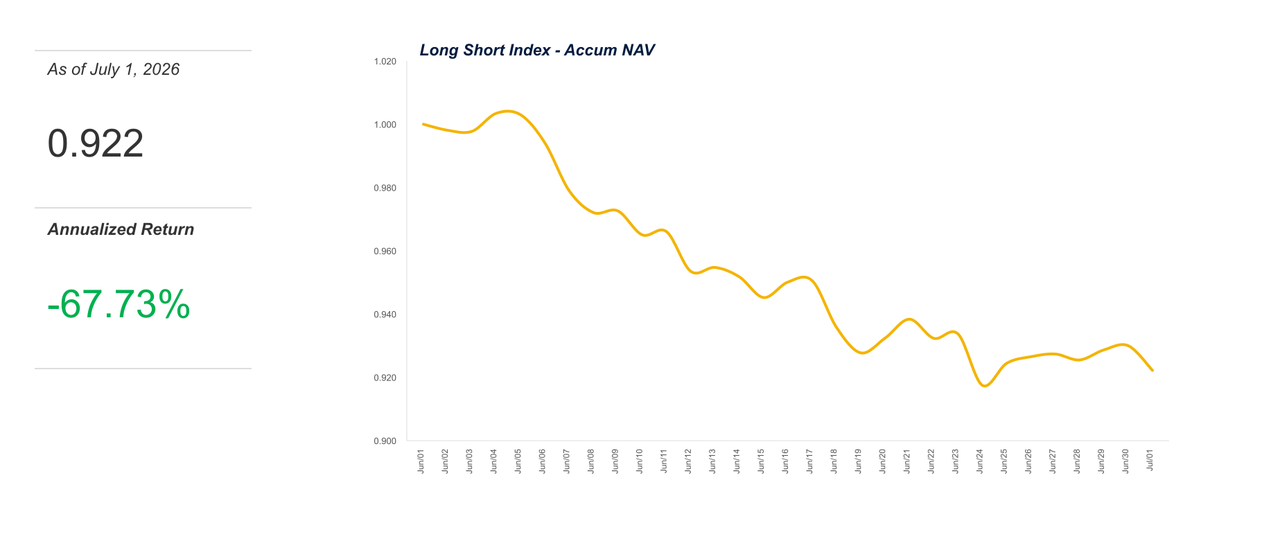
2026-07 | long short index
Note: We use the arithmetic mean instead of the weighted average because the current sample size is relatively small, as weighted averages cannot accurately reflect actual team weights. Therefore, the impact of principal has been normalized.
Indicators
Profit and Loss (PNL) and Risk
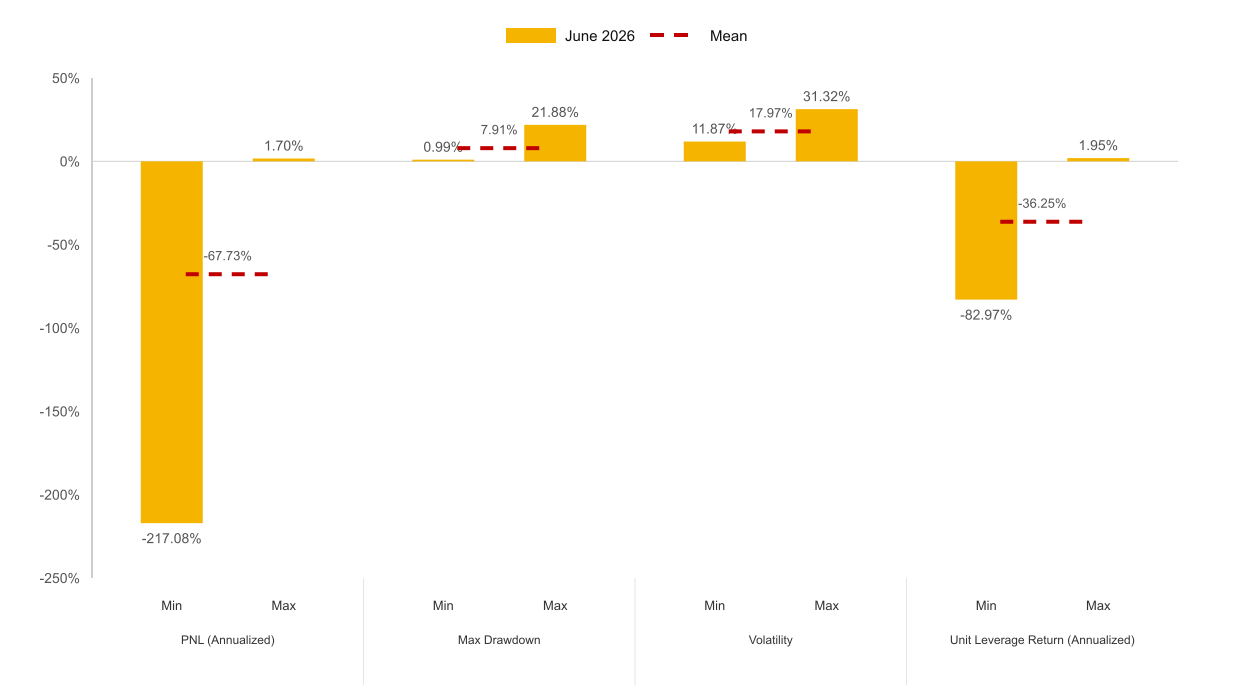
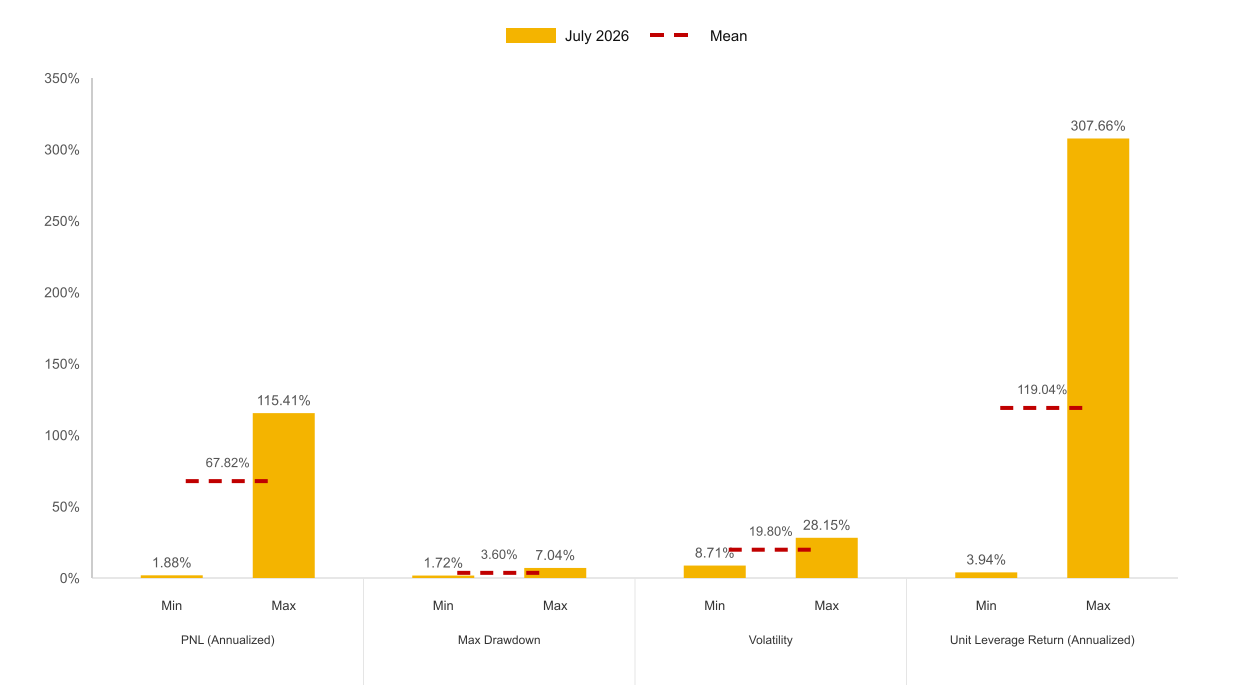
July marked a sharp reversal for Long Short. The index gained 5.76% after losing 7.78% in June, while the average maximum drawdown across participating teams narrowed from 7.91% to 3.60%.
2026-06 | PNL and risk | long short
2026-07 | PNL and risk | long short
Note: See Index Formula for full methodology and calculations.
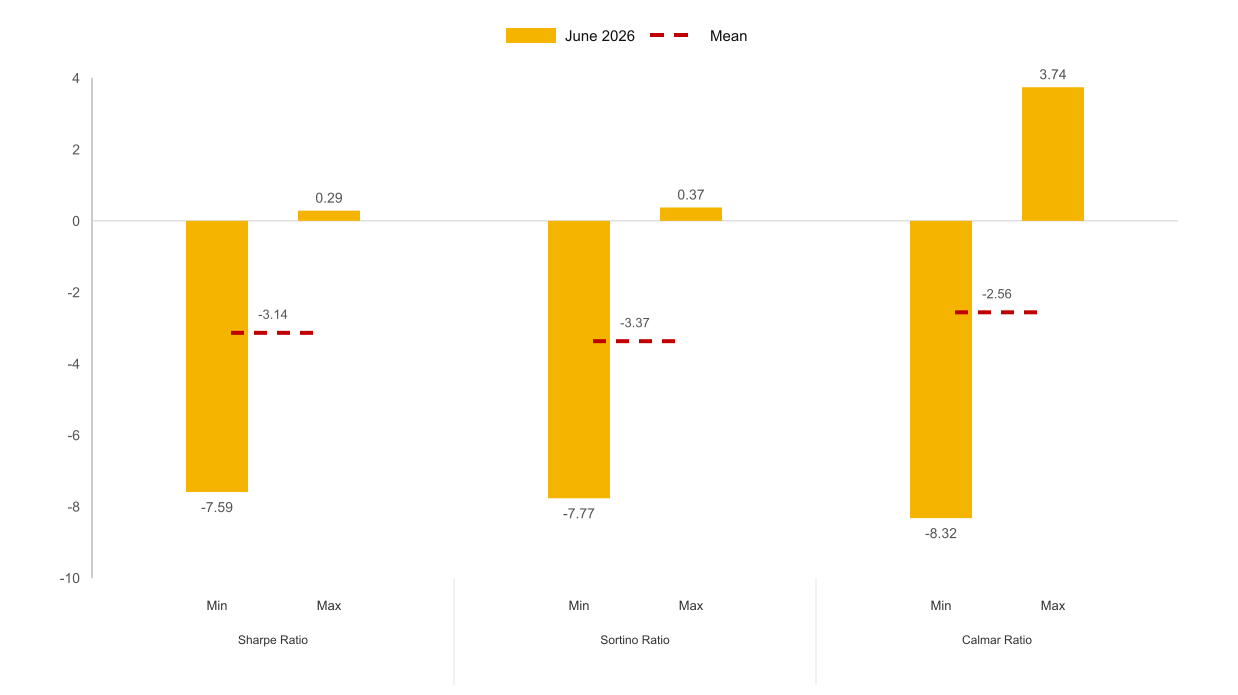
We further assessed risk-adjusted performance through Sharpe Ratio (measuring return per unit of total risk), Sortino Ratio (focusing specifically on downside risk), and Calmar Ratio (evaluating returns relative to maximum drawdown), providing a comprehensive framework to gauge strategy effectiveness across varying market environments.
2026-06 | Risk-adjusted return | long short
2026-07 | Risk-adjusted return | long short
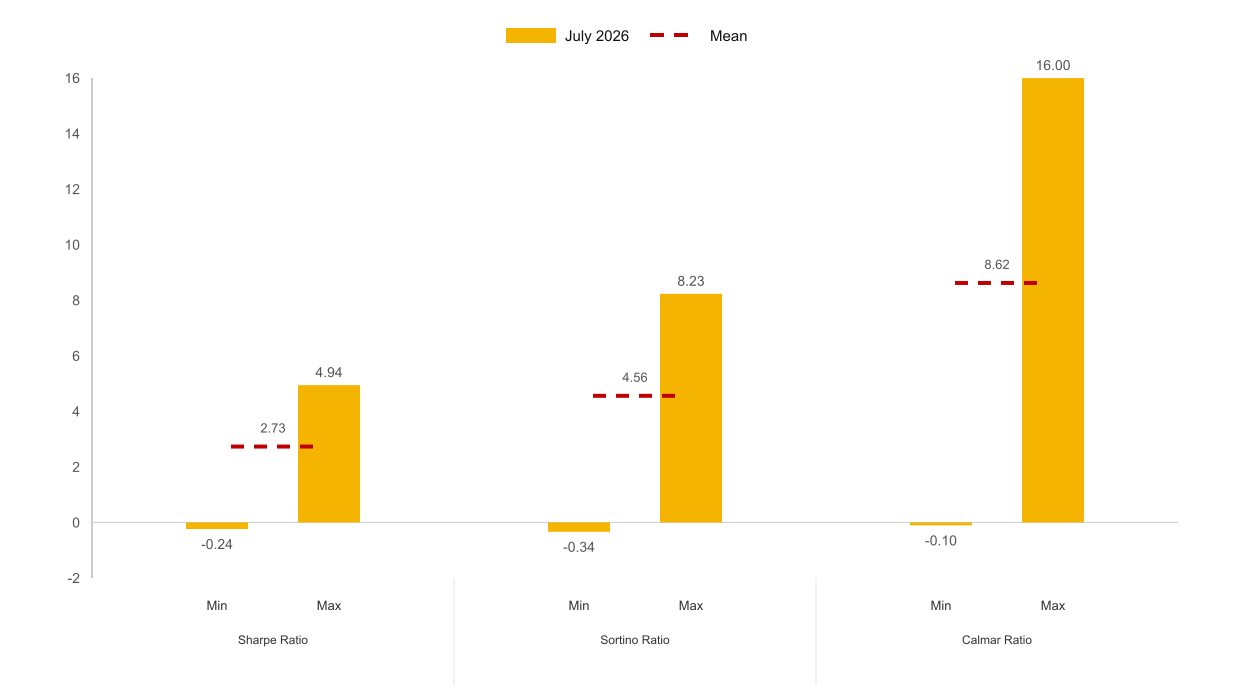
Note: See Index Formula for full methodology and calculations.
Strategy Features
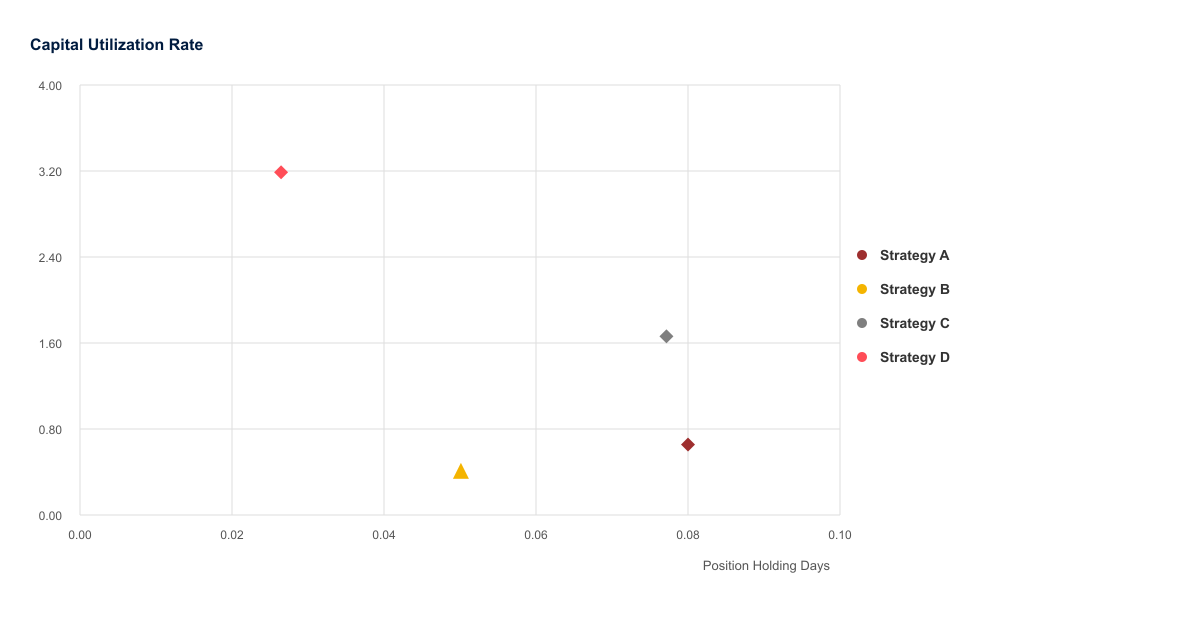
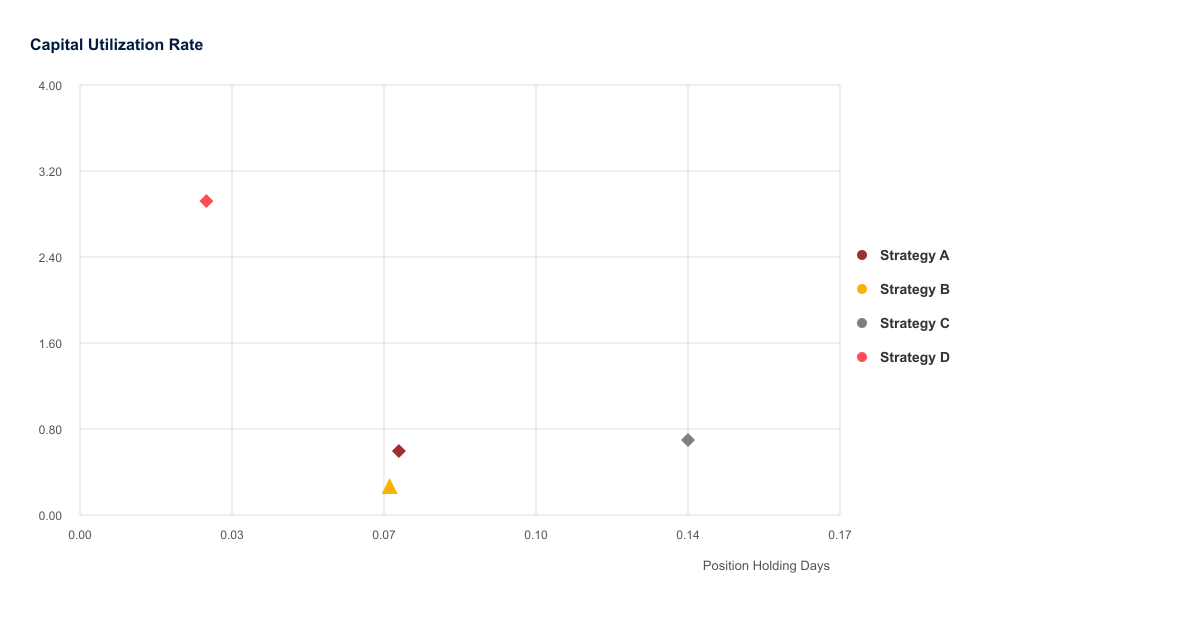
This section introduces two key liquidity metrics for Long Short strategy evaluation: Position Holding Days and Capital Utilization Rate(Turnover Rate).
👍 Position Holding Days serves as a key metric for evaluating capital efficiency.
Key characteristics:
- Inverse relationship with liquidity: Lower turnover days indicate higher strategy liquidity
👍 Capital Utilization Rate measures capital efficiency like turnover rate, but also incorporates margin.
Key characteristics:
- Liquidity indicator: Higher ratios reflect more efficient capital deployment
Position holding days and capital utilization varied widely across the participating teams in both months, pointing to different liquidity and deployment profiles within the Long Short sample.
2026-06 | Position holding days and capital utilization | long short
2026-07 | Position holding days and capital utilization | long short
Note: See Index Formula for full methodology and calculations.
Coin Distributions
We have combined daily snapshot data from trading teams to summarize the asset positions from June 1st, 2026, at 00:00 UTC to August 1st, 2026, at 00:00 UTC, and aggregated the USD exposure for each underlying currency based on the underlying assets.
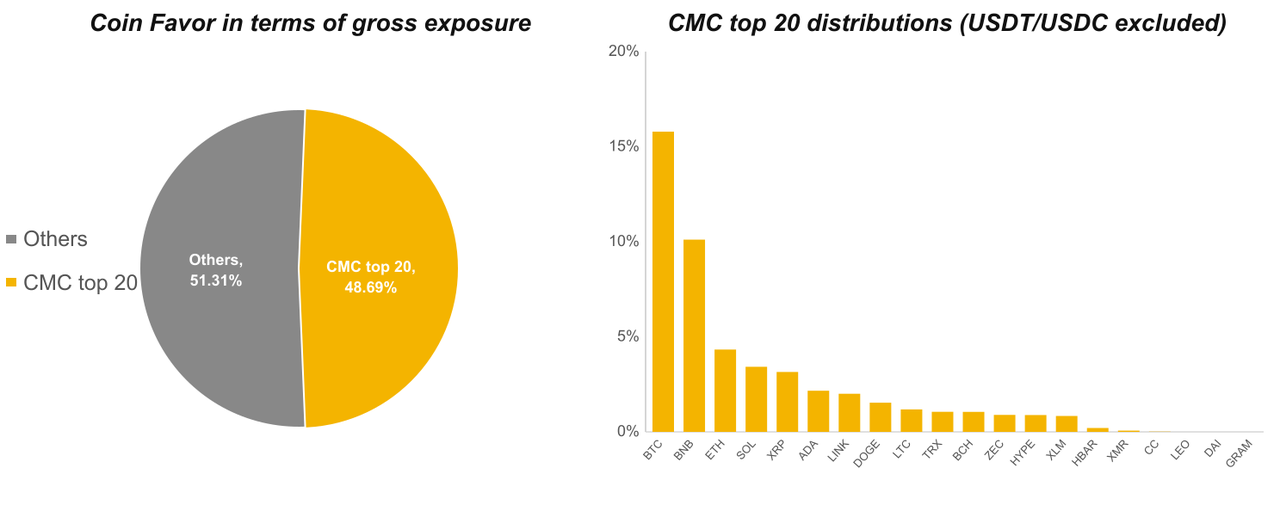
2026-06 | Coin distribution | long short
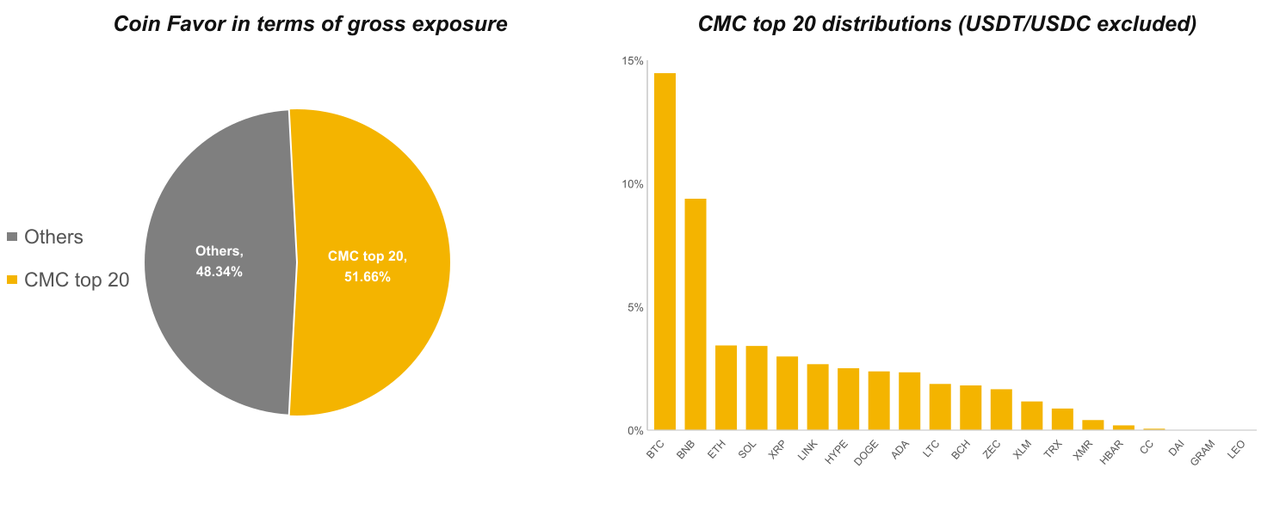
2026-07 | Coin distribution | long short
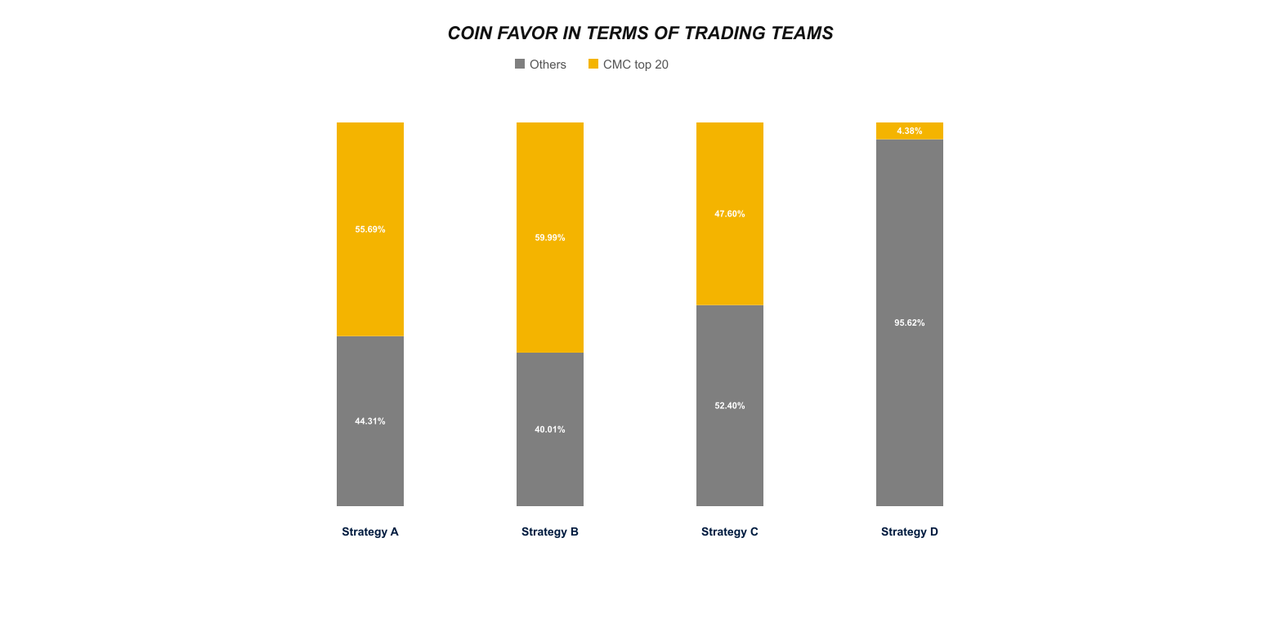
2026-06 | Coin favor by team | long short
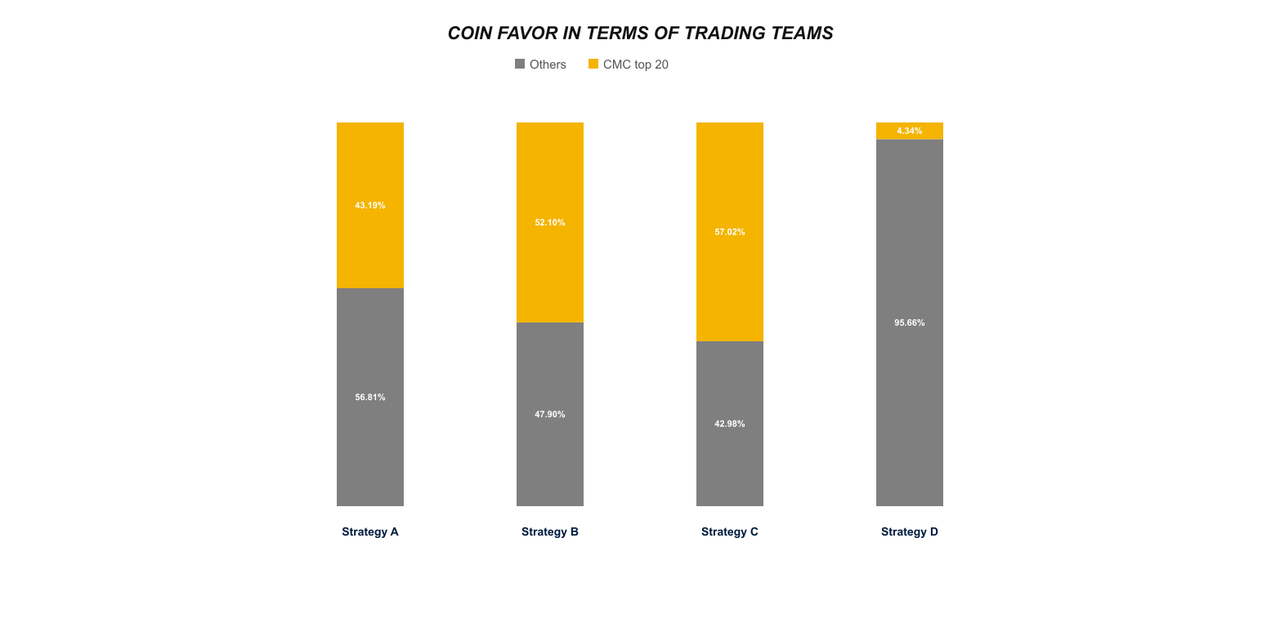
2026-07 | Coin favor by team | long short
2026-06 | CMC top-20 exposure by team | long short
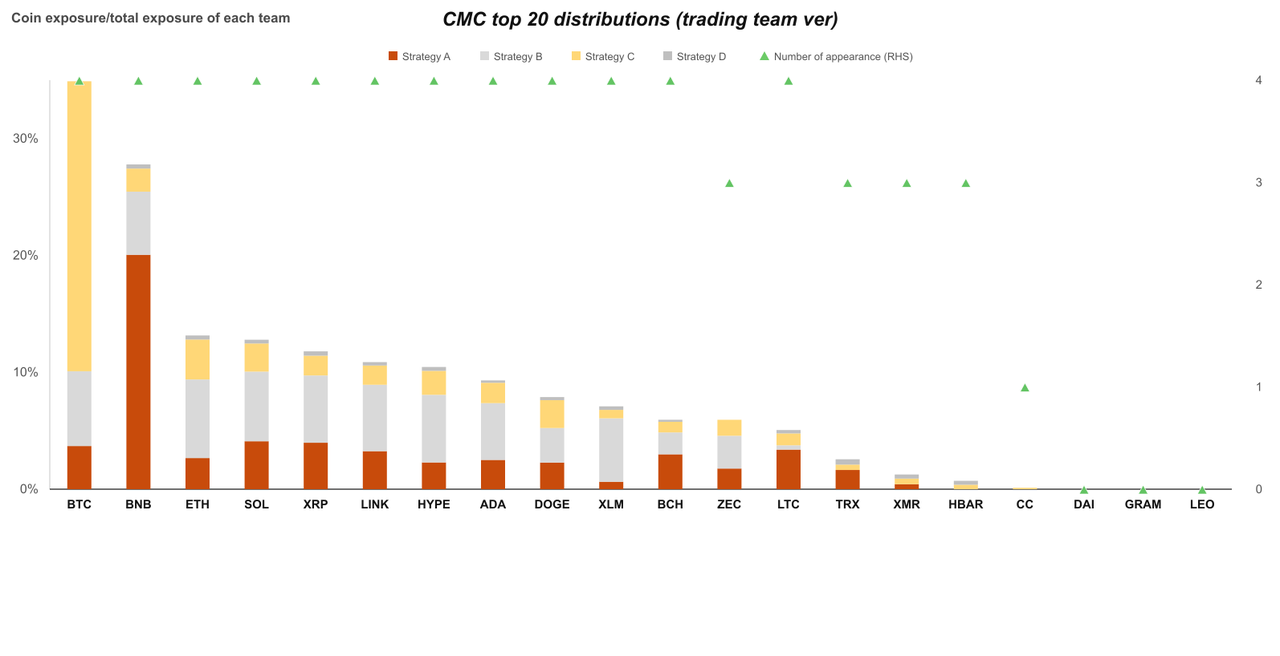
2026-07 | CMC top-20 exposure by team | long short
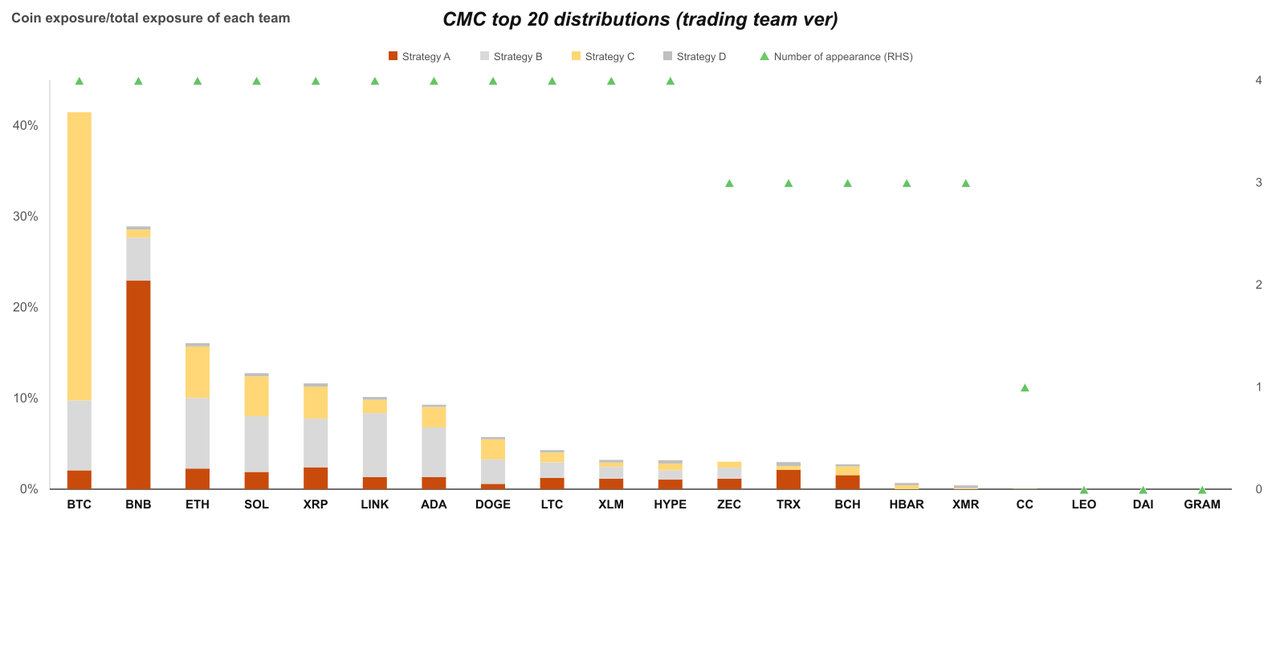
Note:
- USD exposure = Delta * Underlying Price
- See Index Formula for full methodology and calculations.
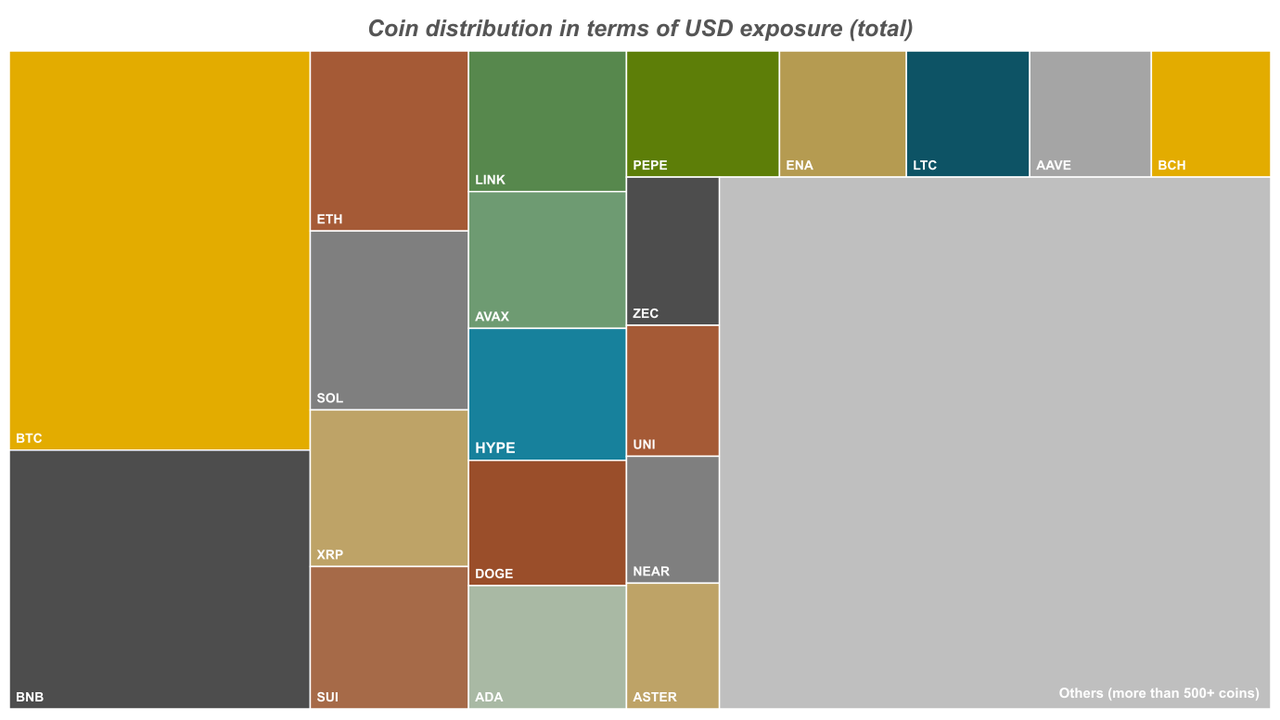
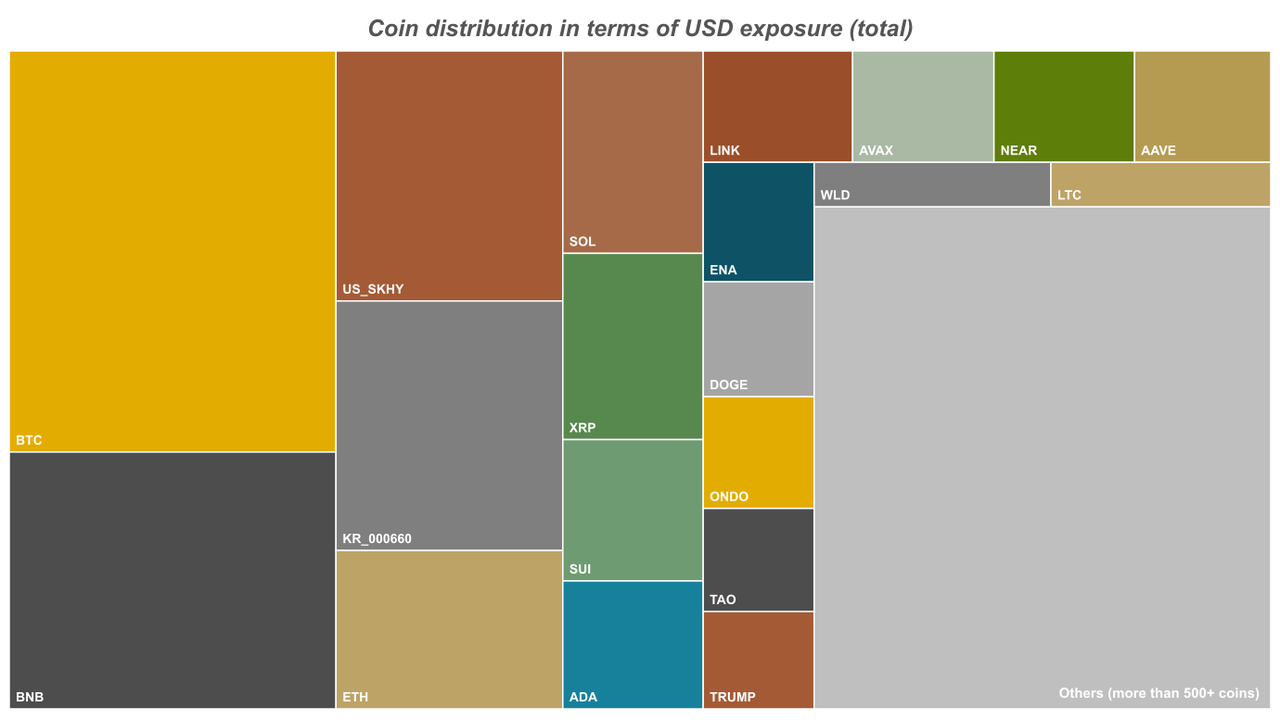
To assess the dispersion across coins, we defined the aggregation degree β (ranging from 0 to 1). When β is closer to 1, it indicates that the investment is more concentrated in a few coins, while when β is closer to 0, it indicates that the investment is more diversified.
2026-06 | Coin exposure treemap | long short
2026-07 | Coin exposure treemap | long short
Calculation method
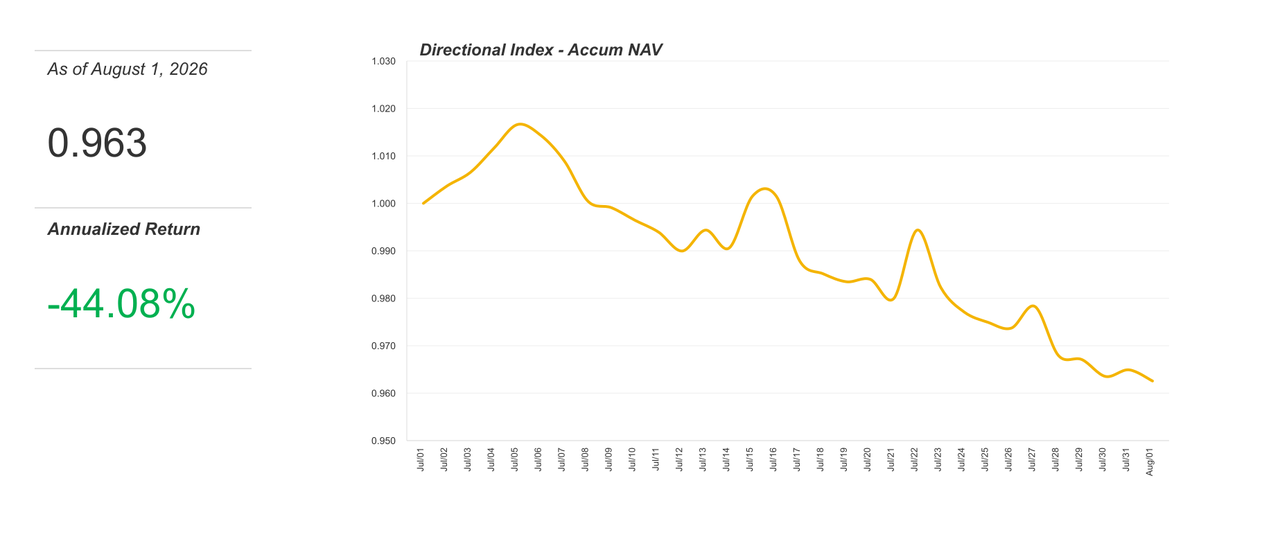
For each reporting month, we rebased each participating team’s portfolio to an initial NAV of 1.000 at 00:00 UTC on the first day of the month. We then calculated each team’s accumulated NAV using the Time-Weighted Return (TWR) method and took the arithmetic mean to construct a market benchmark for Directional strategy.
2026-06 | directional index
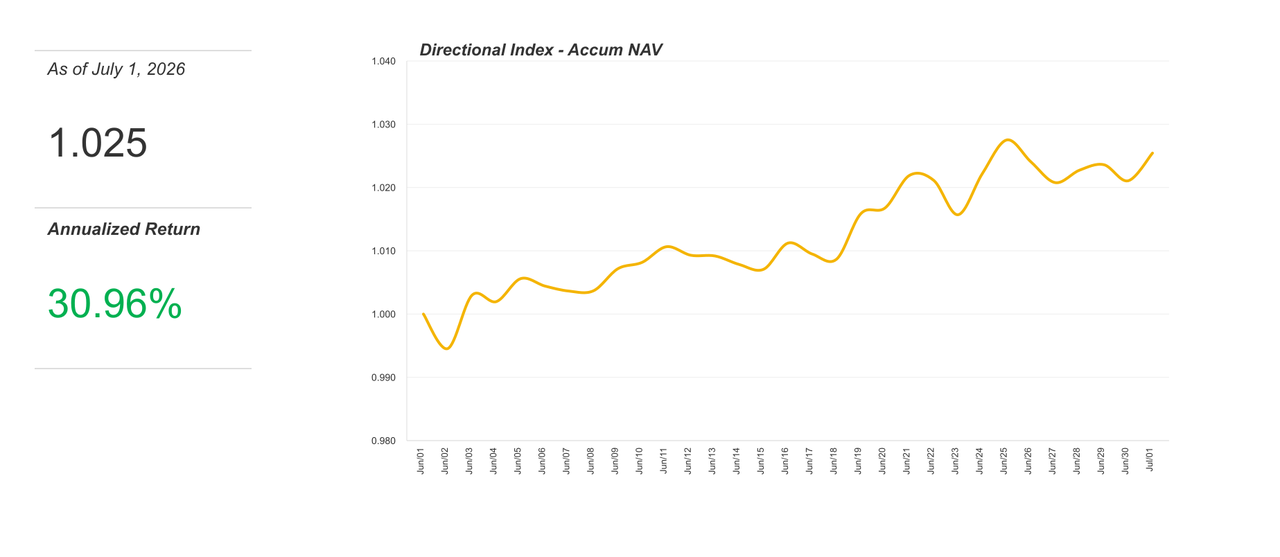
2026-07 | directional index
Note: We use the arithmetic mean instead of the weighted average because the current sample size is relatively small, and the weights in a weighted average cannot accurately reflect the actual weights of the trading team. Therefore, the impact of principal has been normalized.
Indicators
Profit and Loss (PNL) and Risk
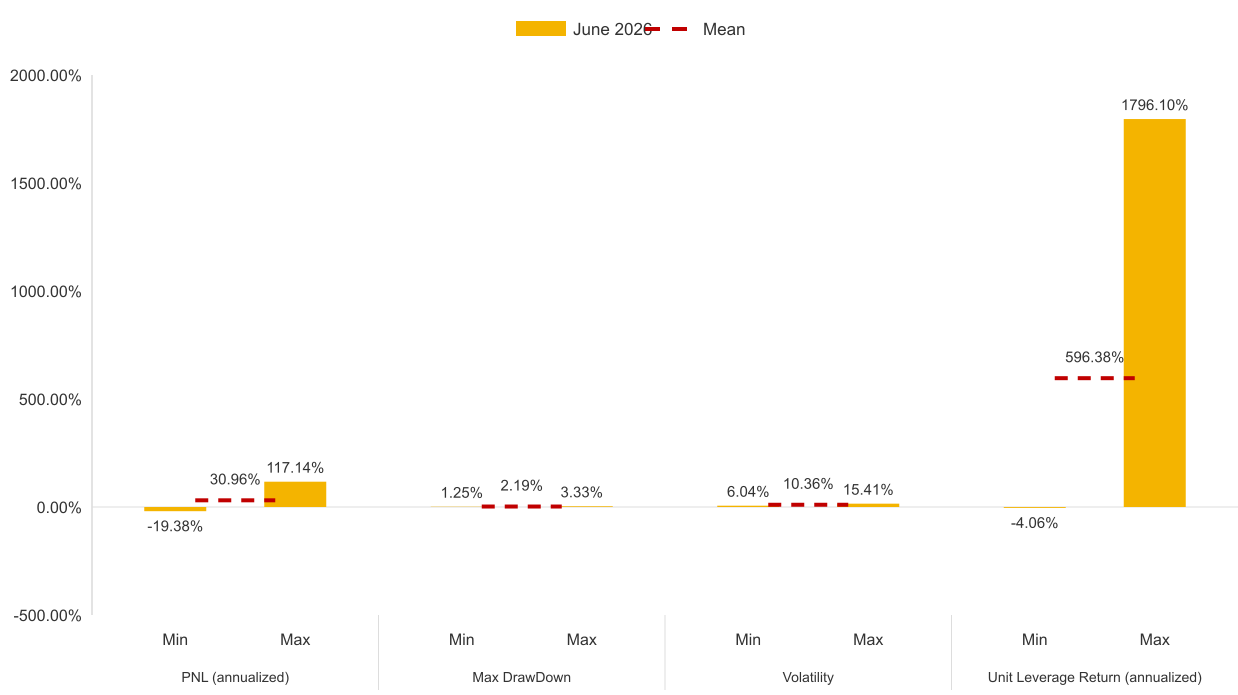
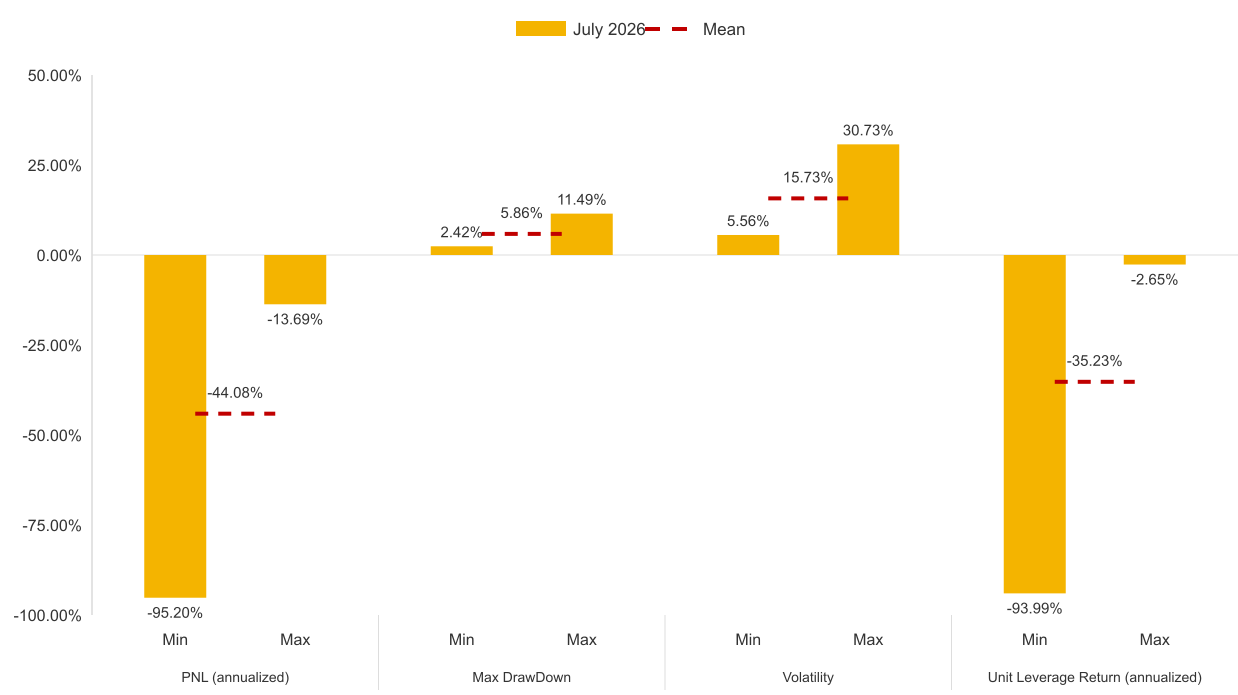
The Directional index reversed course in July, falling 3.74% after a 2.54% gain in June. Average maximum drawdown across participating teams rose from 2.19% to 5.86%.
2026-06 | PNL and risk | directional
2026-07 | PNL and risk | directional
Note: See Index Formula for full methodology and calculations.
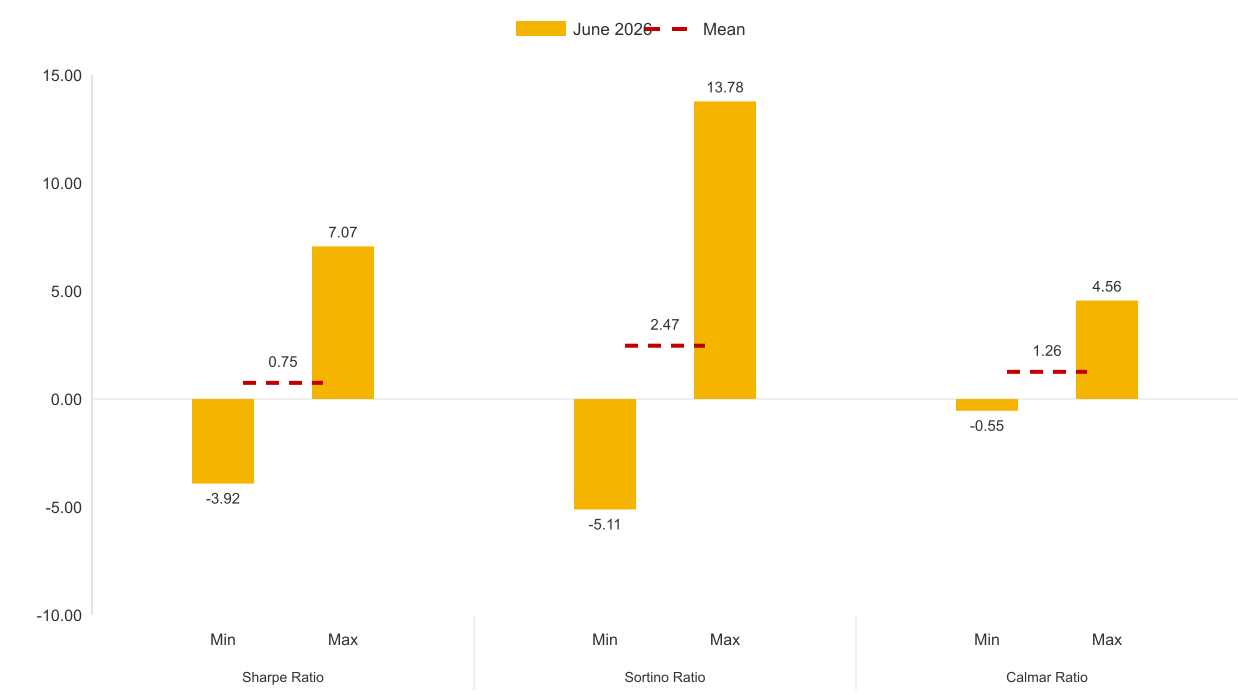
For a strategy defined by its volatility exposure, rigorous risk-adjusted assessment is critical. We employ the Sharpe Ratio to capture return per unit of total risk, the Sortino Ratio to isolate downside performance, and the Calmar Ratio to contextualize returns against peak-to-trough drawdowns. This multi-metric framework enables a nuanced evaluation of directional strategies' efficiency in harvesting macro beta while managing tail risks.
2026-06 | Risk-adjusted return | directional
2026-07 | Risk-adjusted return | directional
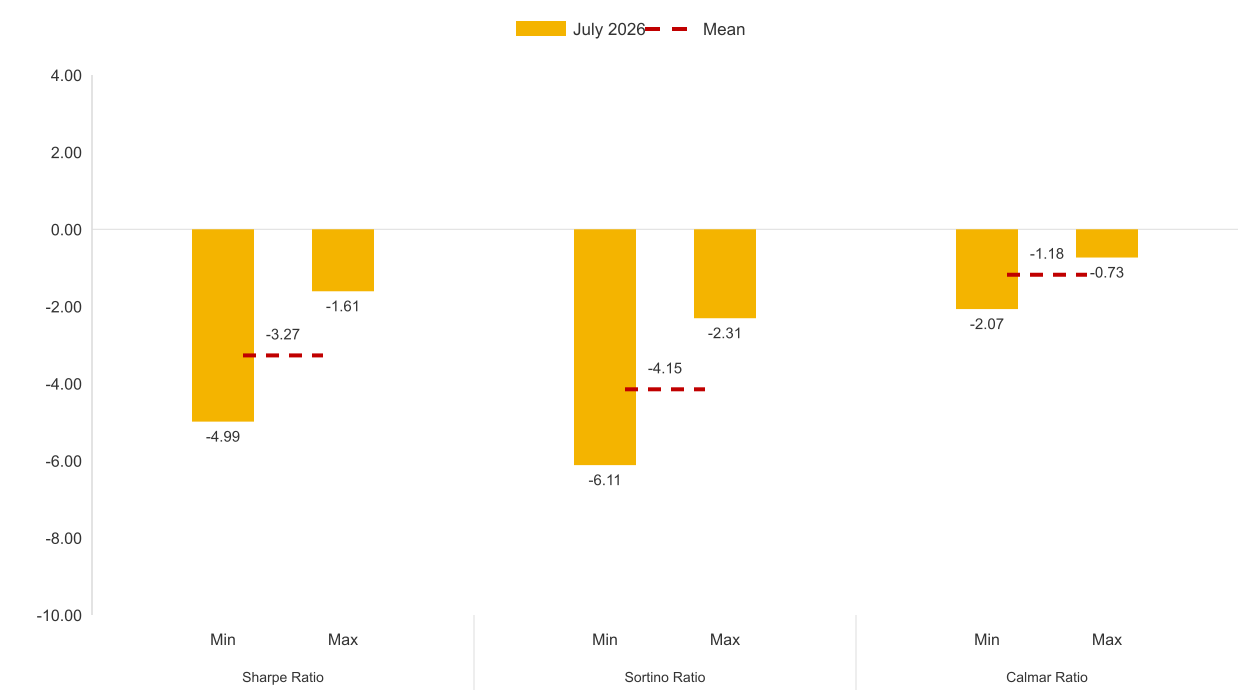
Note: See Index Formula for full methodology and calculations.
Strategy Features
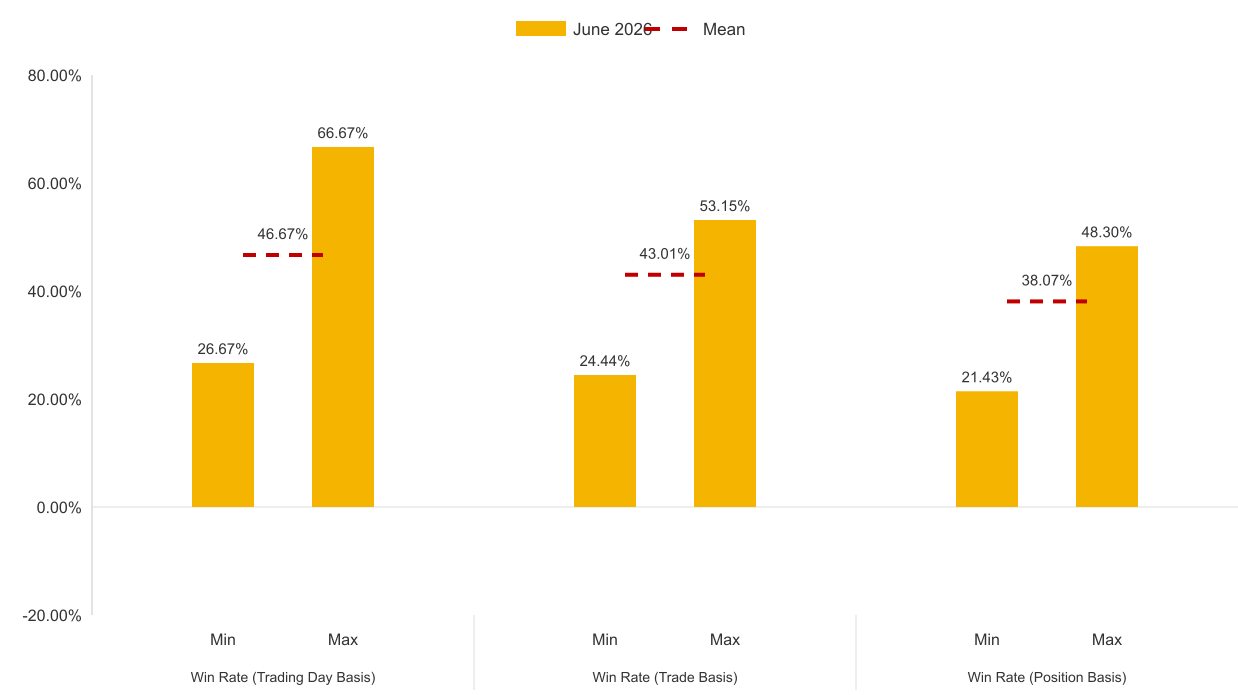
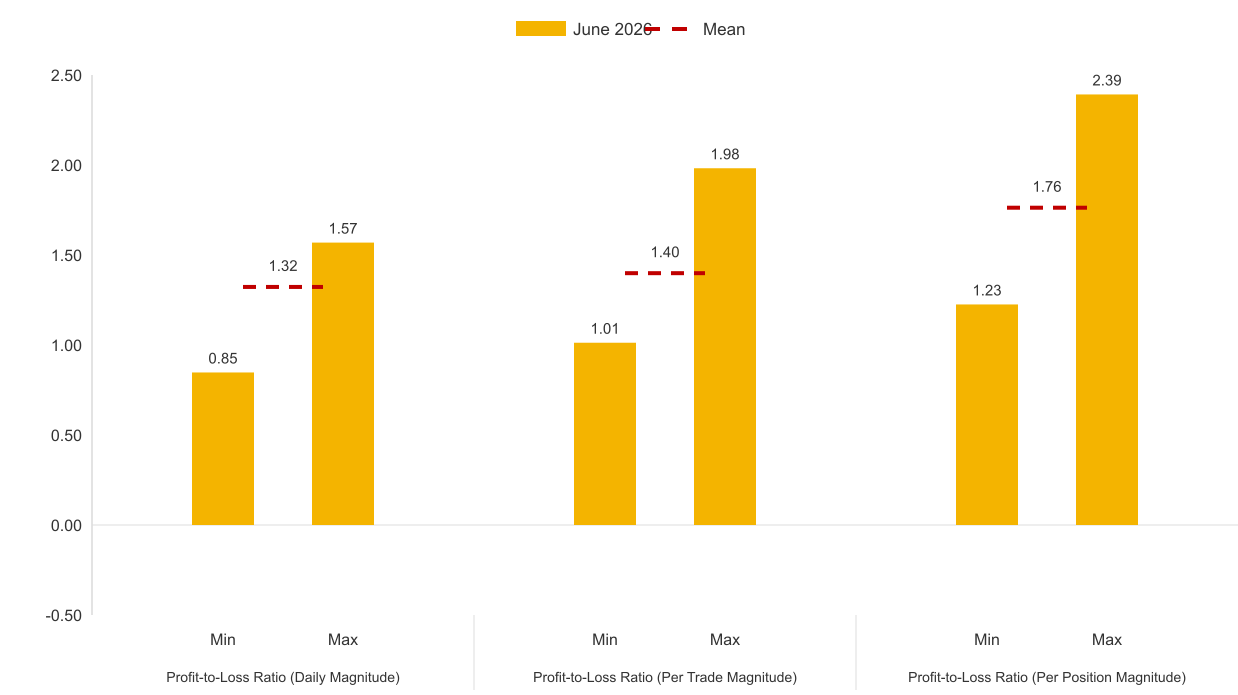
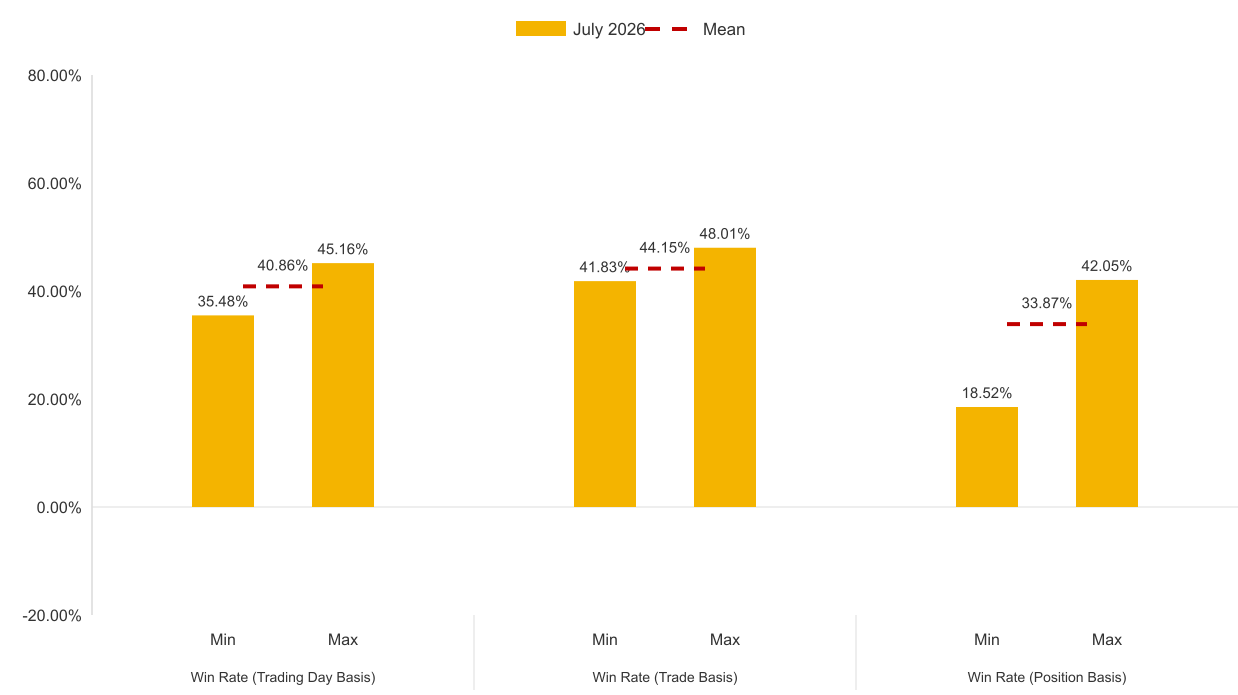
Win rate and profit-to-loss ratio provide a closer look at how Directional returns were generated, measuring the frequency of gains and their size relative to losses. We report both on trading-day, trade and position bases.
In our sample, mean trading-day win rate declined from 46.67% in June to 40.86% in July, while mean daily profit-to-loss ratio dropped from 1.32 to 0.76. Both moves are consistent with the index’s weaker performance in July.
2026-06 | Win rate and Profit-to-loss ratio | directional
2026-07 | Win rate and Profit-to-loss ratio | directional
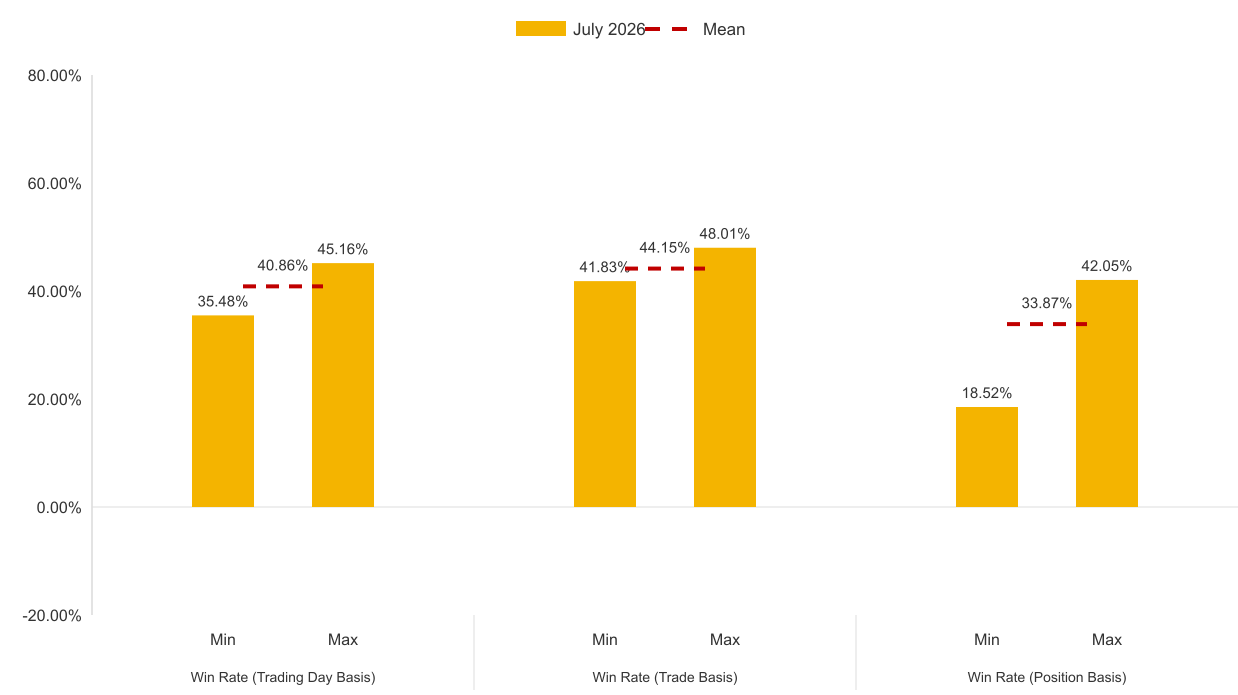
Note: See Index Formula for full methodology and calculations.
Coin Distributions
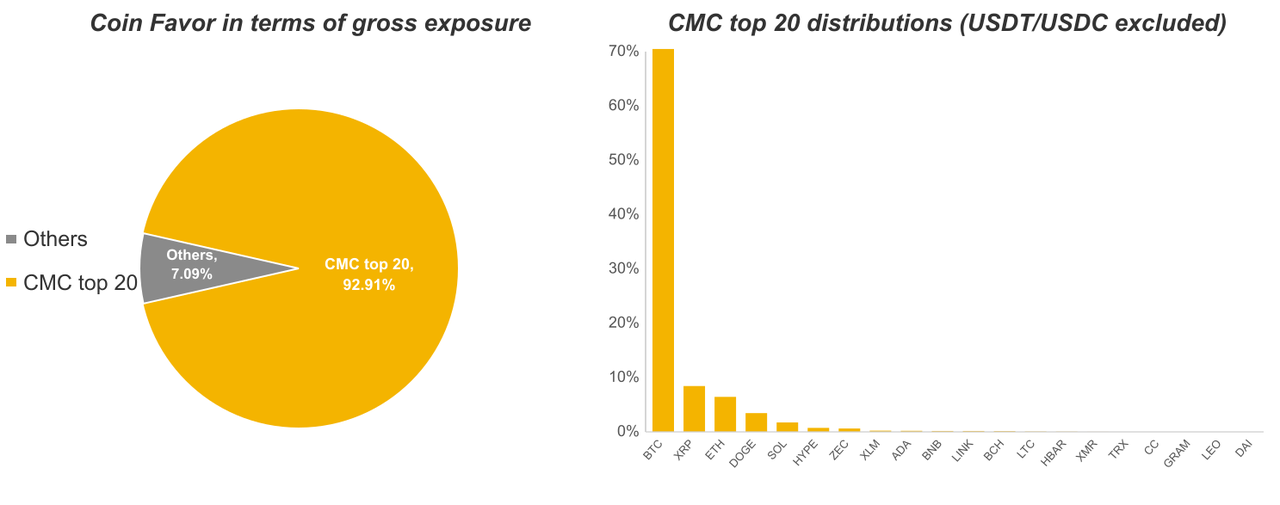
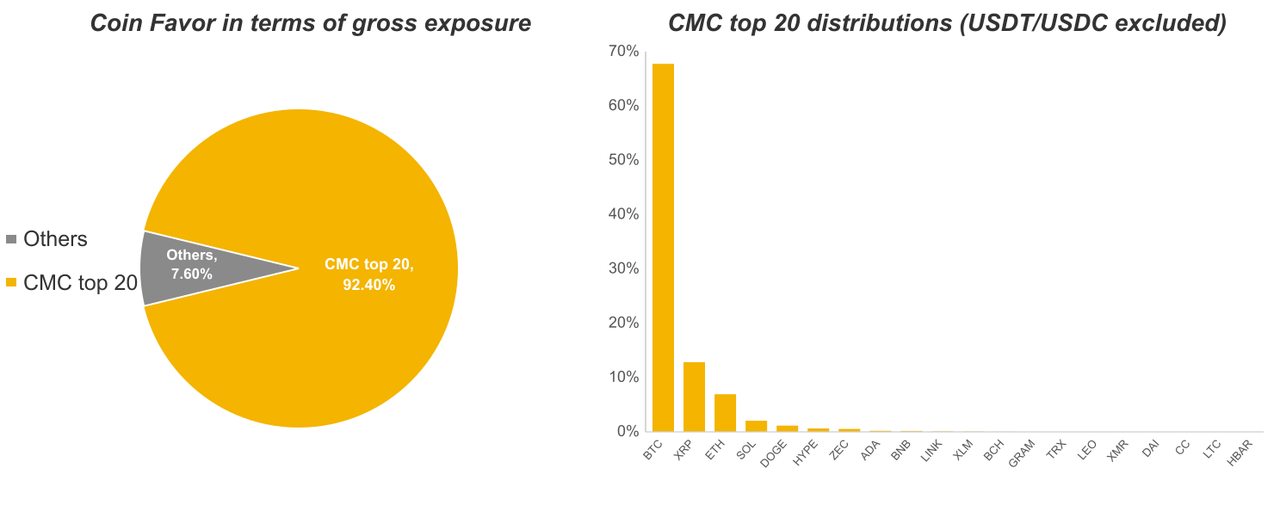
We have combined daily snapshot data from trading teams to summarize the asset positions from June 1st, 2026, at 00:00 UTC to August 1st, 2026, at 00:00 UTC, and aggregated the USD exposure for each underlying currency based on the underlying assets.
2026-06 | Coin distribution | directional
2026-07 | Coin distribution | directional
Note:
- USD exposure = Delta * Underlying Price
- See Index Formula for full methodology and calculations.
To assess the dispersion across coins, we defined the aggregation degree β (ranging from 0 to 1). When β is closer to 1, it indicates that the investment is more concentrated in a few coins, while when β is closer to 0, it indicates that the investment is more diversified.
2026-06 | Coin exposure treemap | directional
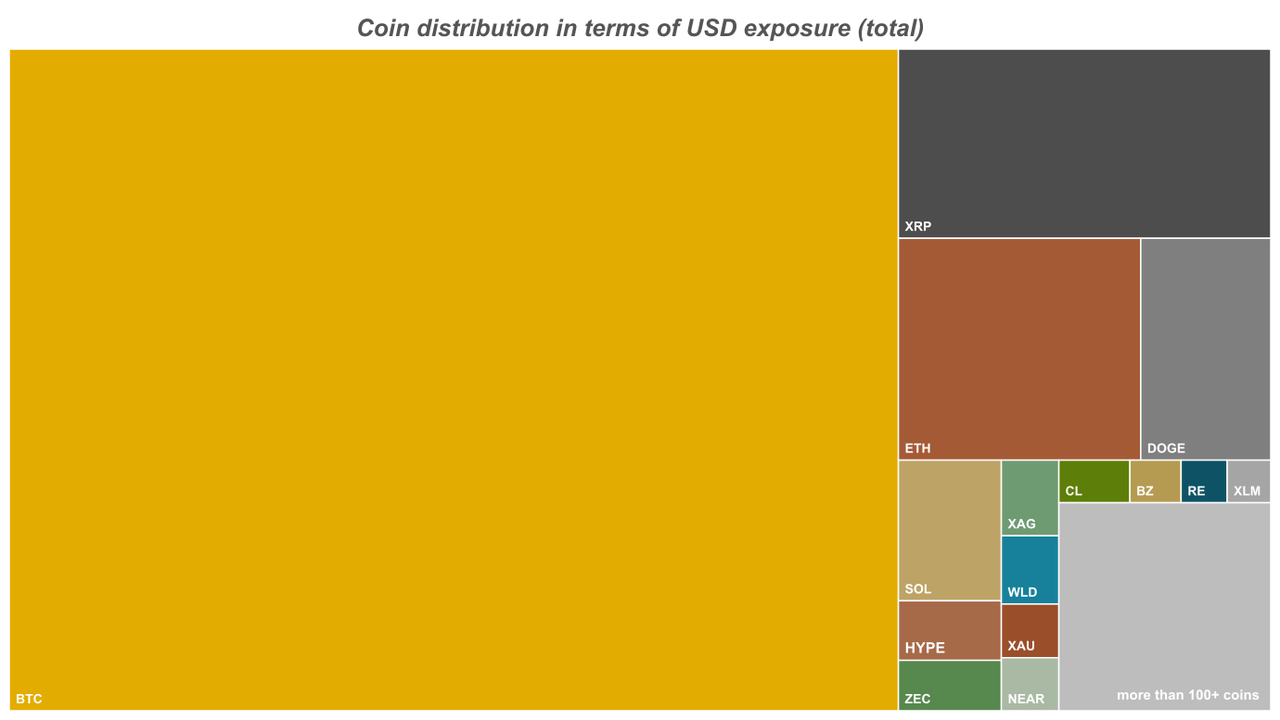
2026-07 | Coin exposure treemap | directional
The combined AUM of the participating teams exceeds $10 billion. We plan to expand the sample across more teams and regions to improve its representativeness and diversity.
Authored by Quinn Hu and Gloria Yao from 1Token, with data kindly provided by 9 trading teams.
Reference
Thanks to the following leading crypto trading teams for collaborating with 1Token on our first crypto strategy-related performance analysis:
- Funding Arb
- Founded in 2018, Binquant focuses on quantitative development and asset management in the digital asset market and is now one of the largest digital asset managers. The main strategies include market-neutral arbitrage, CTA, high frequency, and DeFi. Main clients include hedge funds, VC funds, large financial institutions, family offices, and exchanges for asset accretion.
- Directional
- DSG Tech is a quantitative investment firm specializing in systematic trading across digital assets. The firm applies a multi-strategy approach spanning trend-following CTA, cross-sectional long-short relative value, high-frequency market maker and arbitrage, with a focus on liquid markets and efficient execution. Its investment process is grounded in rigorous empirical research, disciplined risk controls, and continuous refinement of models and infrastructure, with the objective of producing uncorrelated and repeatable returns over time.
- Funding Arb and Long Short
- GrandLine Technologies is a systematic multi-strategy trading firm established in 2018. Grandline specializes in deploying mid-frequency market-neutral strategies across major digital assets on both centralized and decentralized exchanges. With decades of expertise in quantitative portfolio management , the team is recognized for its exceptional research and risk management process, earning accolades from esteemed institutions like Hedgeweek and HFM.
- Funding Arb
- Ladder Research is a quantitative trading firm founded in 2022, focused on delta-neutral arbitrage strategies across markets. The core team has been active in the industry since 2018, with deep experience in exchange microstructure, execution, and risk management.
- Ladder Research operates under a risk-first philosophy, aiming to deliver stable and scalable returns through disciplined execution and long-term iteration.
- Funding Arb
- Luxtech Capital Group Ltd was established in 2018 by a group of fund managers from both domestic and international backgrounds. Focused on the meticulous study of quantitative strategies, we utilize mathematical models and computer technology to discover robust quantitative strategies that transcend market fluctuations. Our expertise lies in asset management for digital assets. Shareholders and team members are derived from the professional traditional asset management industry, with a cumulative managed fund scale exceeding 10 billion RMB, and their collective experience is traceable. Research personnel hold Master's and Ph.D. degrees from renowned universities such as the University of Illinois at Urbana-Champaign, Tsinghua University, and Shanghai Jiao Tong University. They have previously worked in core departments at Akuna Capital and Citadel, demonstrating solid foundational knowledge and extensive experience in the quantitative industry.
- Funding Arb
- JZL Capital, specializing in Spot-Perpetual Arbitrage, is a top-tier quantitative team in Asia providing stable return performance and achieving over $200 million in AUM. The core team comprises members passionate about academic research and actively expanding its global client base by providing unparalleled quantitative trading solutions.
- Funding Arb and Long Short
- Established in 2014, Pythagoras manages a suite of crypto funds based on quantitative modeling. As one of the longest-running crypto hedge funds, it is known for delivering outstanding returns in both bearish and bullish market cycles. Using systematic, non-discretionary, and automated trading strategies, Pythagoras specializes in market-neutral and dollar-neutral strategies to consistently outperform the crypto market.
- Funding Arb
- Tackzone Research is a quantitative research and strategy management fund focused on the digital asset market. We are committed to delivering stable and sustainable return solutions for investors through systematic strategies, rigorous risk controls, and efficient execution.
- With long-term expertise in crypto derivatives and arbitrage, the team conducts quantitative research across funding rates, spread structures, liquidity conditions, and market microstructure, and has built an automated trading system spanning multiple exchanges and diverse strategy types.
- We have established a full end-to-end closed loop covering strategy R&D, backtesting and evaluation, live trading operations, and risk management, ensuring disciplined implementation and continuous improvement across the entire investment lifecycle.
- Long Short
- ZenX was founded in 2019 and is headquartered in Hong Kong. ZenX is an innovative and established crypto trading firm with a focus on cutting-edge technology, data-driven solutions, and algorithmic modeling. We aim to build long-term relationships with clients by offering tailor-made services with professional trading expertise.
Collaboration teams for this study primarily come from Asia. In the future, we hope to expand the diversity of our sample to include teams across various regions around the world. If you'd like to be part of our benchmark study, please feel free to contact our partnership manager at joey.shi@1tokentech.com.
About 1Token
1Token(https://1token.tech/) is a SOC2 Compliant software for institutional Crypto Portfolio, Risk, Operations, Accounting and Lending Management, named Hedgeweek's 2024 "Portfolio Management Solution of the Year", serving 100+ top-tier institutional clients in the crypto industry, including Family Offices, SMA Allocators, Multi-Strategies Trading Funds, DMA Prime Brokers, Asset Managers, Lending Institutions, Fund Admins & Auditors across the US, EU, and APAC, collectively managing over $20 billion in assets.
For general inquiries like authorization requests of the report, product demo, or general collaboration opportunities, please email service@1token.trade.
Disclaimer
The information contained in this report is provided by 1Token for general informational purposes only and does not constitute professional advice. While every effort has been made to ensure the accuracy of the information, no warranty or representation, express or implied, is made regarding its completeness or reliability. The contents of this report reflect the views and opinions of the author(s) as of the date of publication, and may be subject to change without notice.
The reader should independently verify any information or conclusions presented herein before making decisions based on the report. 1Token and any affiliated parties are not responsible for any actions taken or not taken as a result of reading this report.
This report may contain forward-looking statements, estimates, and projections based on current expectations. These statements are subject to risks and uncertainties that could cause actual results to differ materially from those anticipated. 1Token assumes no obligation to update or revise any forward-looking statements.
Read next
Crypto Quant Strategy Index XIII May 2026
Crypto Quant Strategy Index XII April 2026
Comments ()